Figures
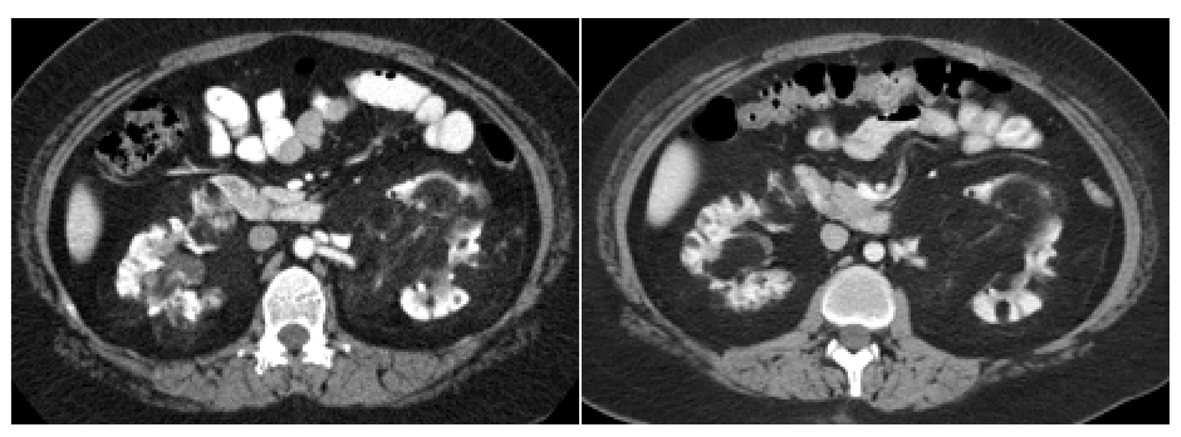
Figure 1. Right renal hilar AML lesion pre and post everolimus therapy for eleven months. The right renal hilar AML lesion measured 2.8 cm × 2.1 cm in cross section and 1.8 cm CC. This is seen in the picture on the left. This lesion increased in size to 3.2 cm × 2.2 cm in cross section and 2.4 cm CC on the CT scan of the abdomen done eleven months after everolimus treatment and is seen in the picture on the right. Its density was 5 HU in the initial CT scan of the abdomen and had decreased to -86 HU in the CT scan done eleven months after initiation of everolimus.
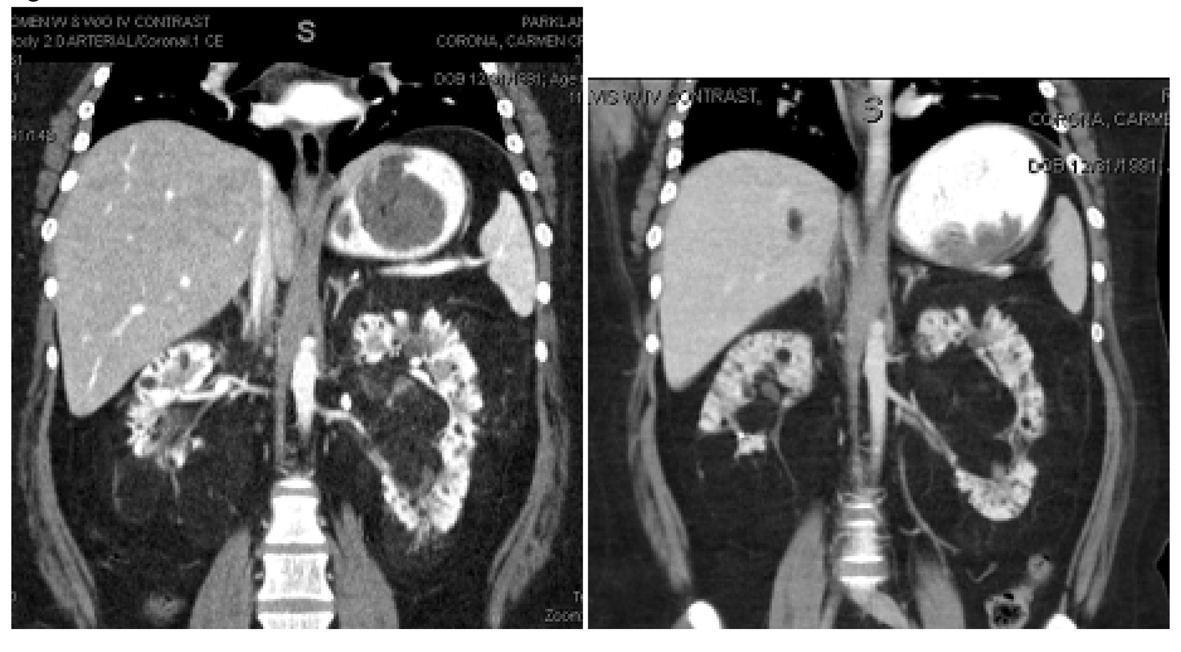
Figure 2. Left renal hilar lesions pre and post everolimus therapy for eleven months. In the left kidney, the renal hilum was markedly splayed by a conglomerate of fatty AML lesions seen in the image on the left. The image on the right depicts an increasing amount of fat content and a decrease in vascularity after eleven months of treatment with everolimus.
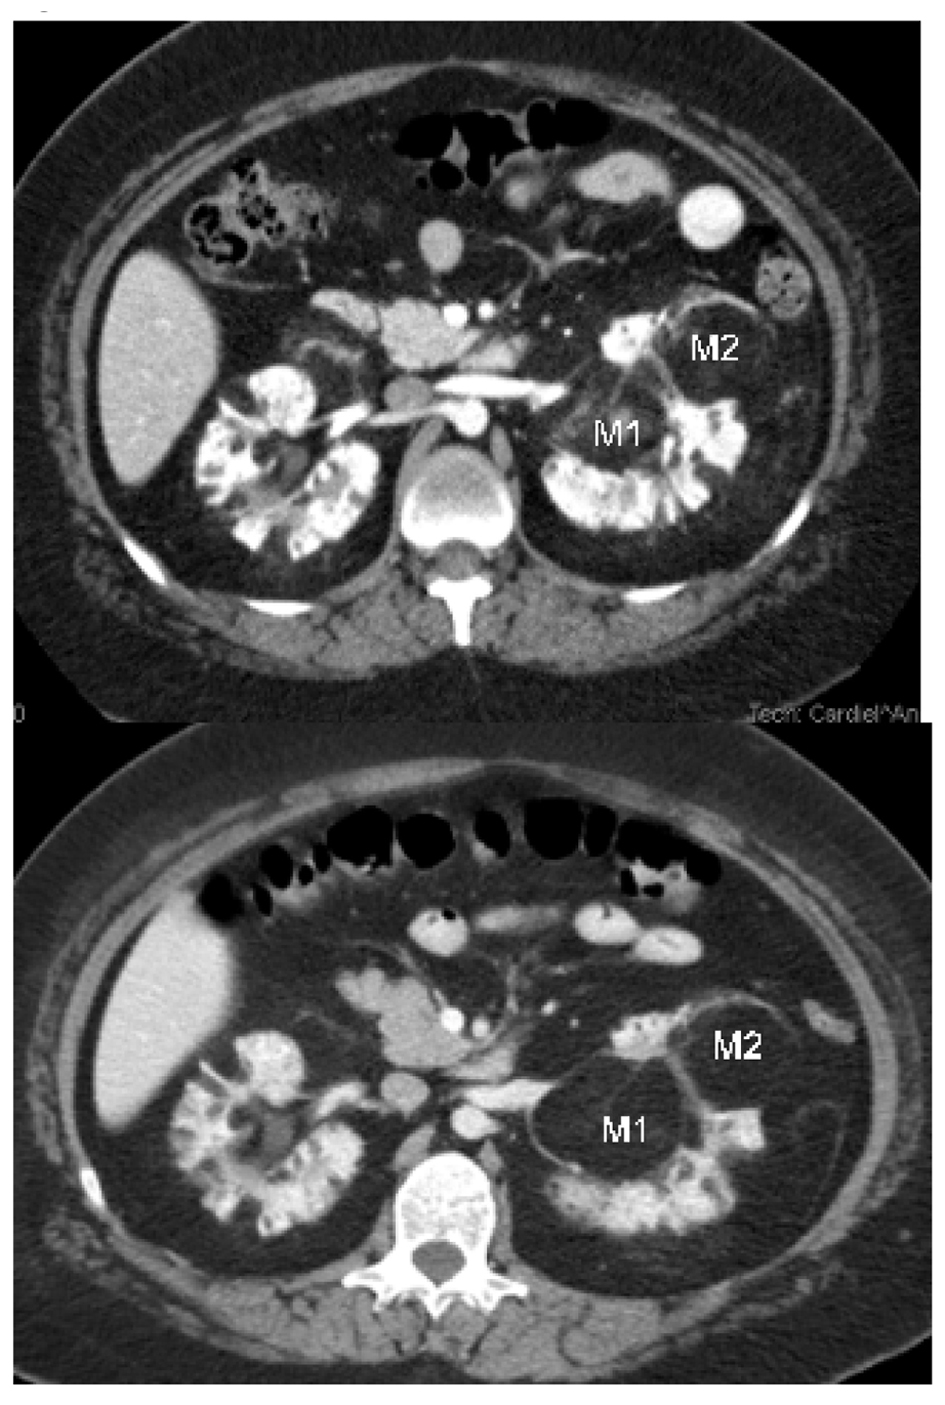
Figure 3. Left renal hilar AML lesions. M1: An AML lesion in the left renal hilum projecting medially, measured 4.9 cm AP and 8.7 cm × 4.9 cm on coronal view after eleven months of therapy with everolimus, seen in the second image. This compared to 4.8 cm AP and 7.9 cm × 4.8 cm on coronal view on the initial CT scan of the abdomen depicted in the first image. After eleven months of treatment with everolimus the density of the left renal hilar AML lesion described above decreased from -54 HU to -86 HU and the mass appeared less vascular. M2: A mass in the mid segment of the left kidney projecting anteriorly, measured 3.9cm AP and 4.8 cm × 5.3 cm on coronal view after eleven months of therapy with everolimus depicted in the second image. This compared to 4.8 cm AP and 4.1 cm × 4.7 cm on coronal view on initial CT scan of the abdomen which is depicted in the first image. After eleven months of treatment with everolimus the density of the left renal hilar AML lesion described above decreased from -77 HU to -96 HU and the mass appeared less vascular.
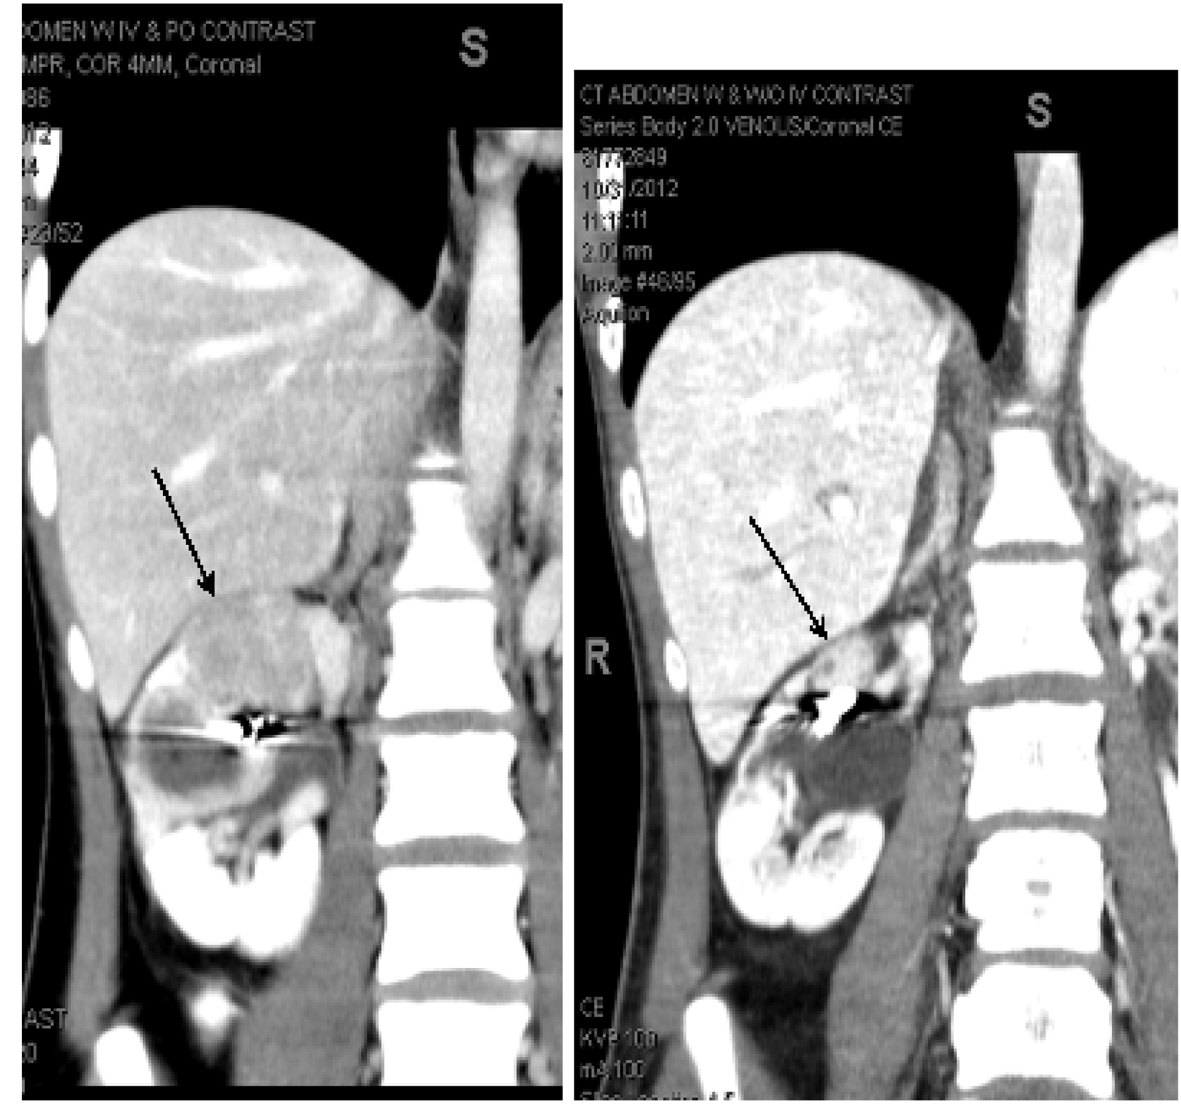
Figure 4. AML lesions of mid segment of right kidney. The image on the left showed an AML lesion involving the mid segment of the right kidney measuring 4.5 cm × 4.5 cm in cross section and 3.5 cm CC. Three months after treatment with everolimus, this AML lesion had decreased in size to 1.9 cm × 1.9 cm in diameter and 1.8 cm CC. Five months after treatment with everolimus, the same lesion was stable and measured 2.0 cm × 2.0 cm in diameter and 1.8 cm CC. This is depicted in the picture on the right. Of note, the radiographic density of the right renal mid segment AML lesion increased during treatment with everolimus.
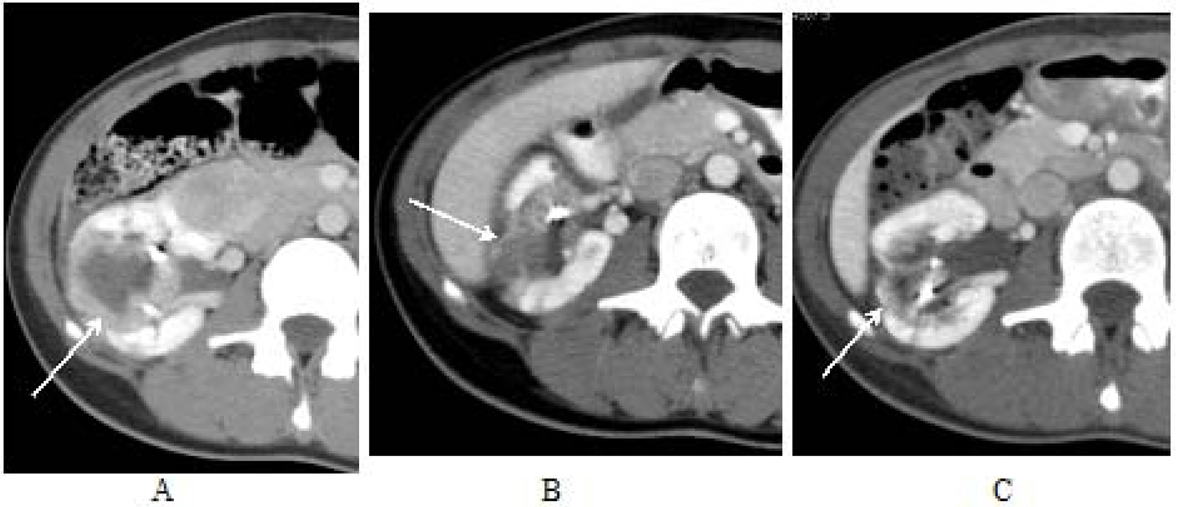
Figure 5. AML lesions of middle of right kidney. An AML lesion located in the middle of the right kidney measured 4.0 cm × 4.5 cm on the initial CT scan prior to everolimus therapy (image A). Three months after treatment it measured 2.3 cm × 2.8 cm in cross section (image B) and was difficult to delineate at five months post therapy initiation with everolimus (image C).
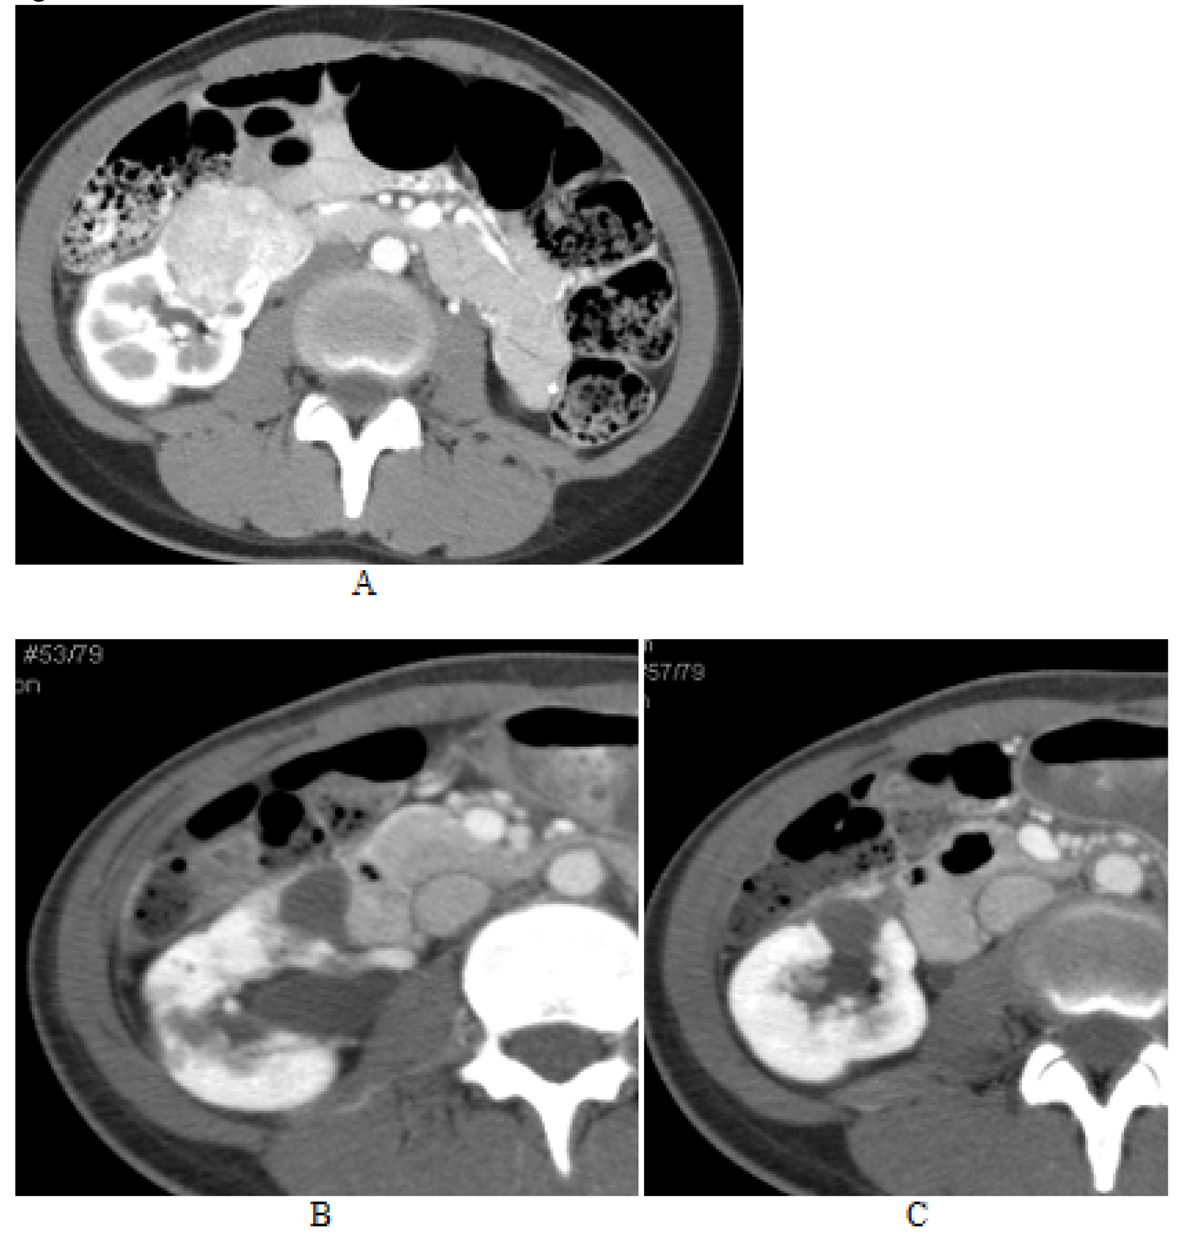
Figure 6. AML lesion of lower pole of right kidney. A large solid mass involving the lower pole of the right kidney (image A) becomes cystic after three months of everolimus treatment (image B). It appears as two adjacent but separate cysts. The first of the two lesions located in the hilum of the right kidney, projecting anteriorly, had decreased in size to 1.5 cm × 1.9 cm in cross section and 1.8 cm CC five months after treatment with everolimus (image C) compared to 2.1 cm × 2.2 cm in cross section and 2.4 cm CC three months after initiation of everolimus (image B). A cyst located adjacent to this AML lesion, which was previously 2.0 cm × 2.4 cm cross section and 2.2 cm CC (image B), also decreased in size to 1.4 cm × 1.8 cm in cross section and 1.4 cm CC on the CT completed at five months post treatment (image C).