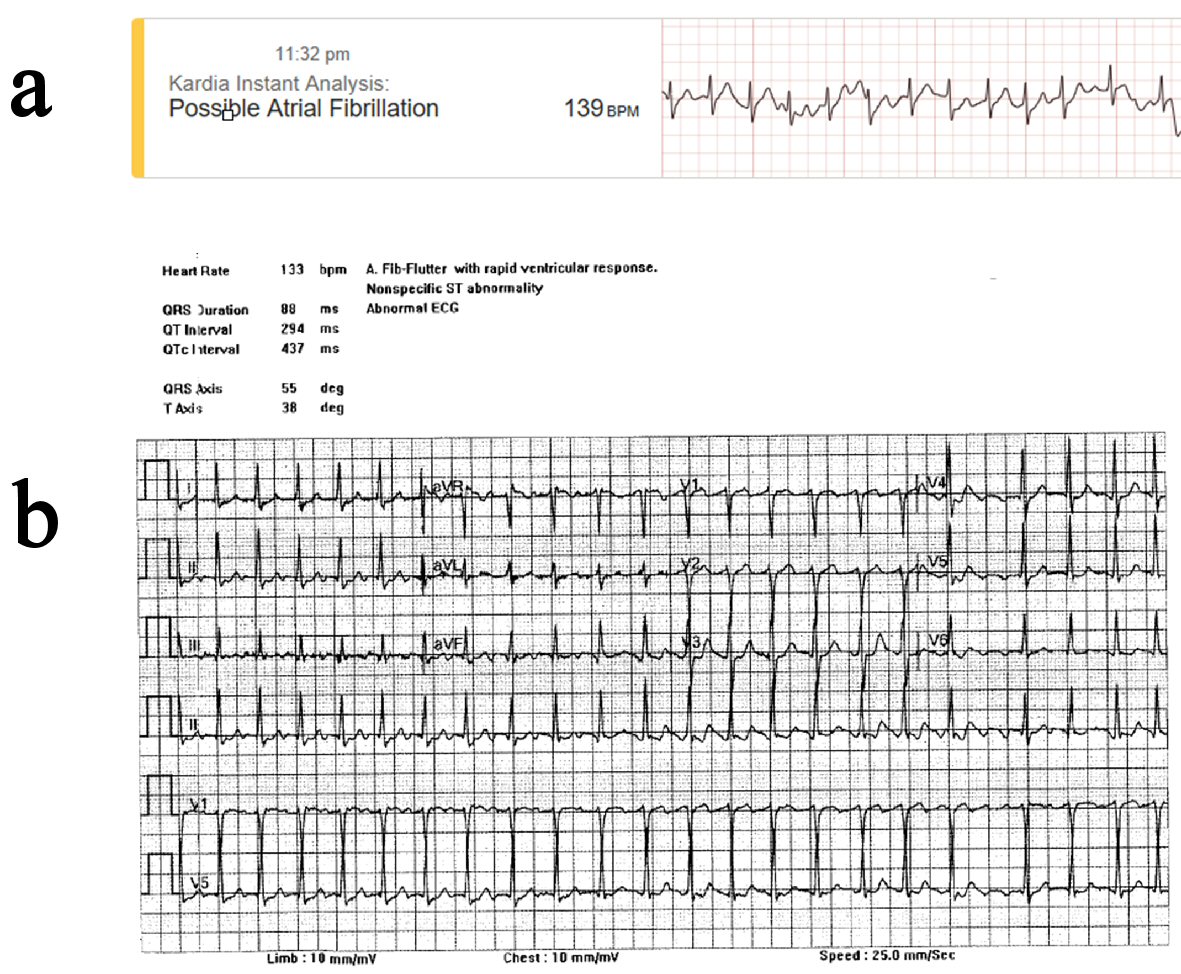
Figure 1. EKG data indicating abnormal arrhythmia as classified by ambulatory and standard EKG. (a) AliveCor Kardia Mobile Device, ambulatory (11:23 PM). (b) 12-lead EKG, hospitalized (12:26 AM).
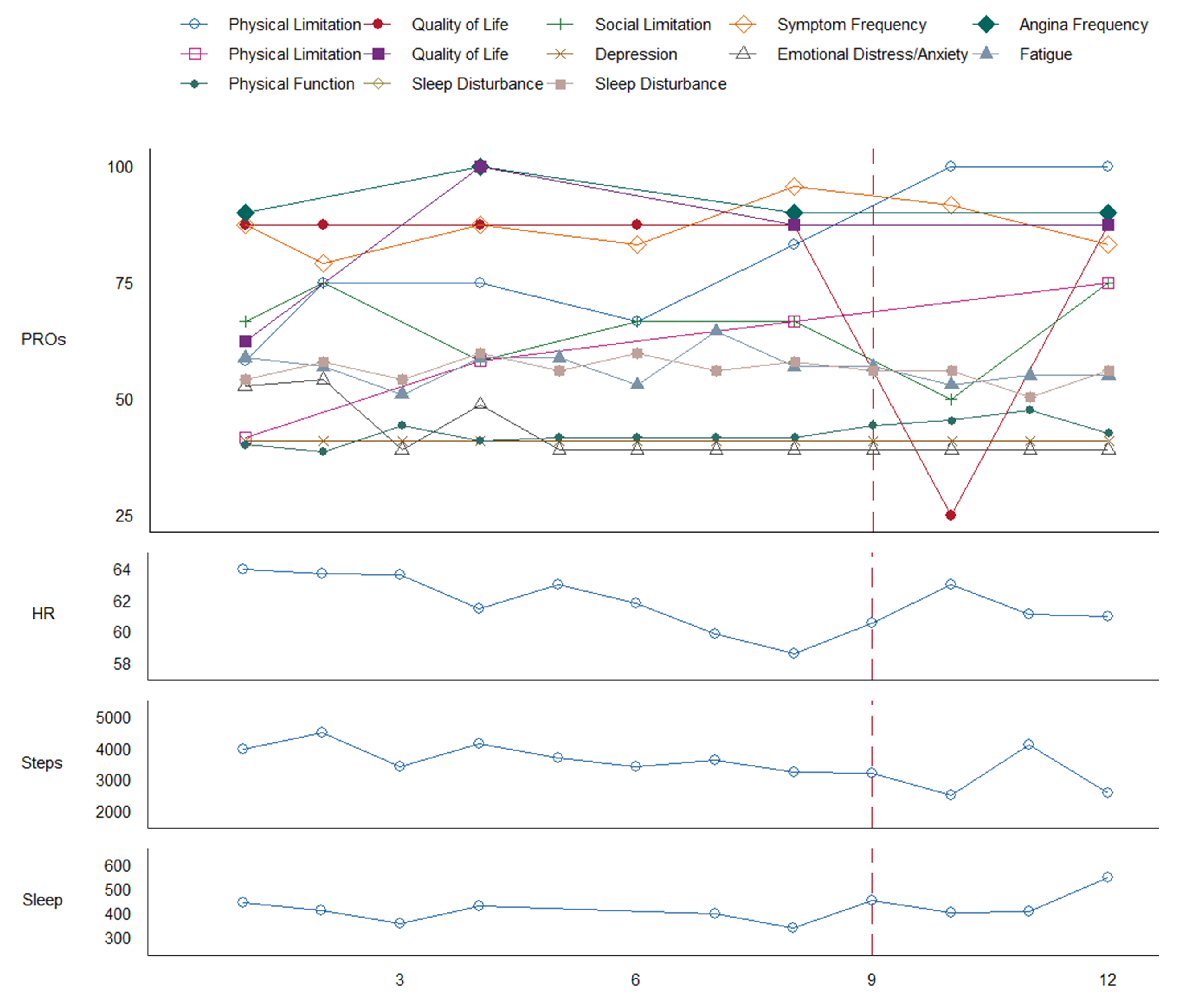
Figure 2. Patient-reported outcomes (PROs) and remote patient monitoring (RPM) measured over 12 weeks. X-axis represents time in weeks. Solid box in legend indicates Kansas City Cardiomyopathy Questionnaire (KCCQ); dotted box in legend indicates Seattle Angina Questionnaire (SAQ). KCCQ and SAQ measures are coded such that low scores indicate poorer outcome, all other measures are coded such that low scores indicate less of a construct. Sleep is in units of minutes per day. A vertical dashed line marks confirmed AFib-Flutter with subsequent hospitalization.
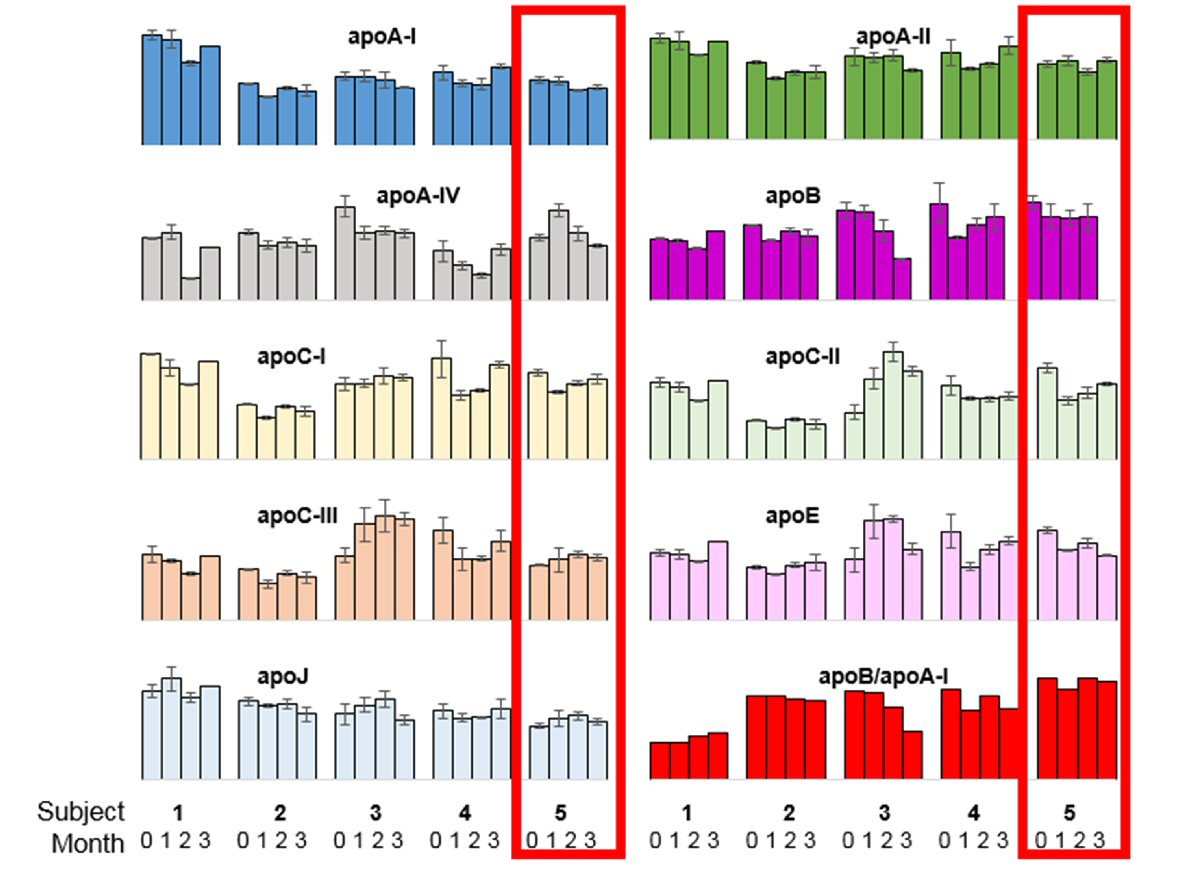
Figure 3. Overview of intra- and inter-individual (n = 5) biomarker measurements for nine apolipoproteins and the ratio of apolipoprotein B to apolipoprotein A-I. The five clusters of columns represent five different subjects: 1) No events; 2) Confirmed AFib-Flutter (Day 49), not admitted; 3) No events; 4) No events; 5) Confirmed AFib-Flutter (Day 64), admitted (case patient, outlined in red). The four bars within each cluster represent the four sampling time points obtained by Mitra® devices (baseline, 1 month, 2 months, and 3 months). Error bars indicate the standard deviation between duplicate measurements (two tips per time point).