Figures
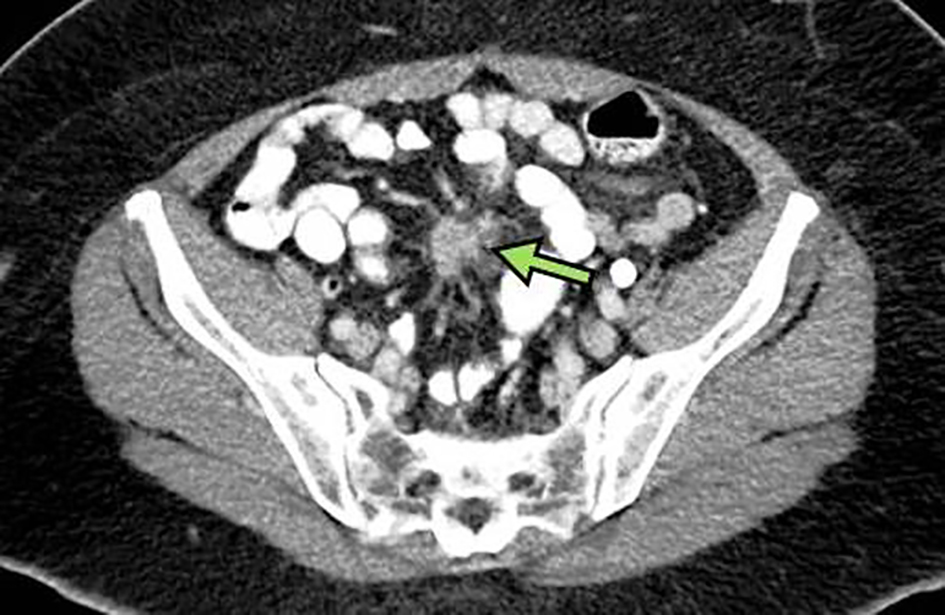
Figure 1. Abdominal CT scan of mass (arrow) involving mesentery compatible with a neuroendocrine tumor measuring approximately 2.1 × 1.8 cm in orthogonal axial dimensions and up to 3.1 cm in craniocaudal extent. CT: computed tomography.
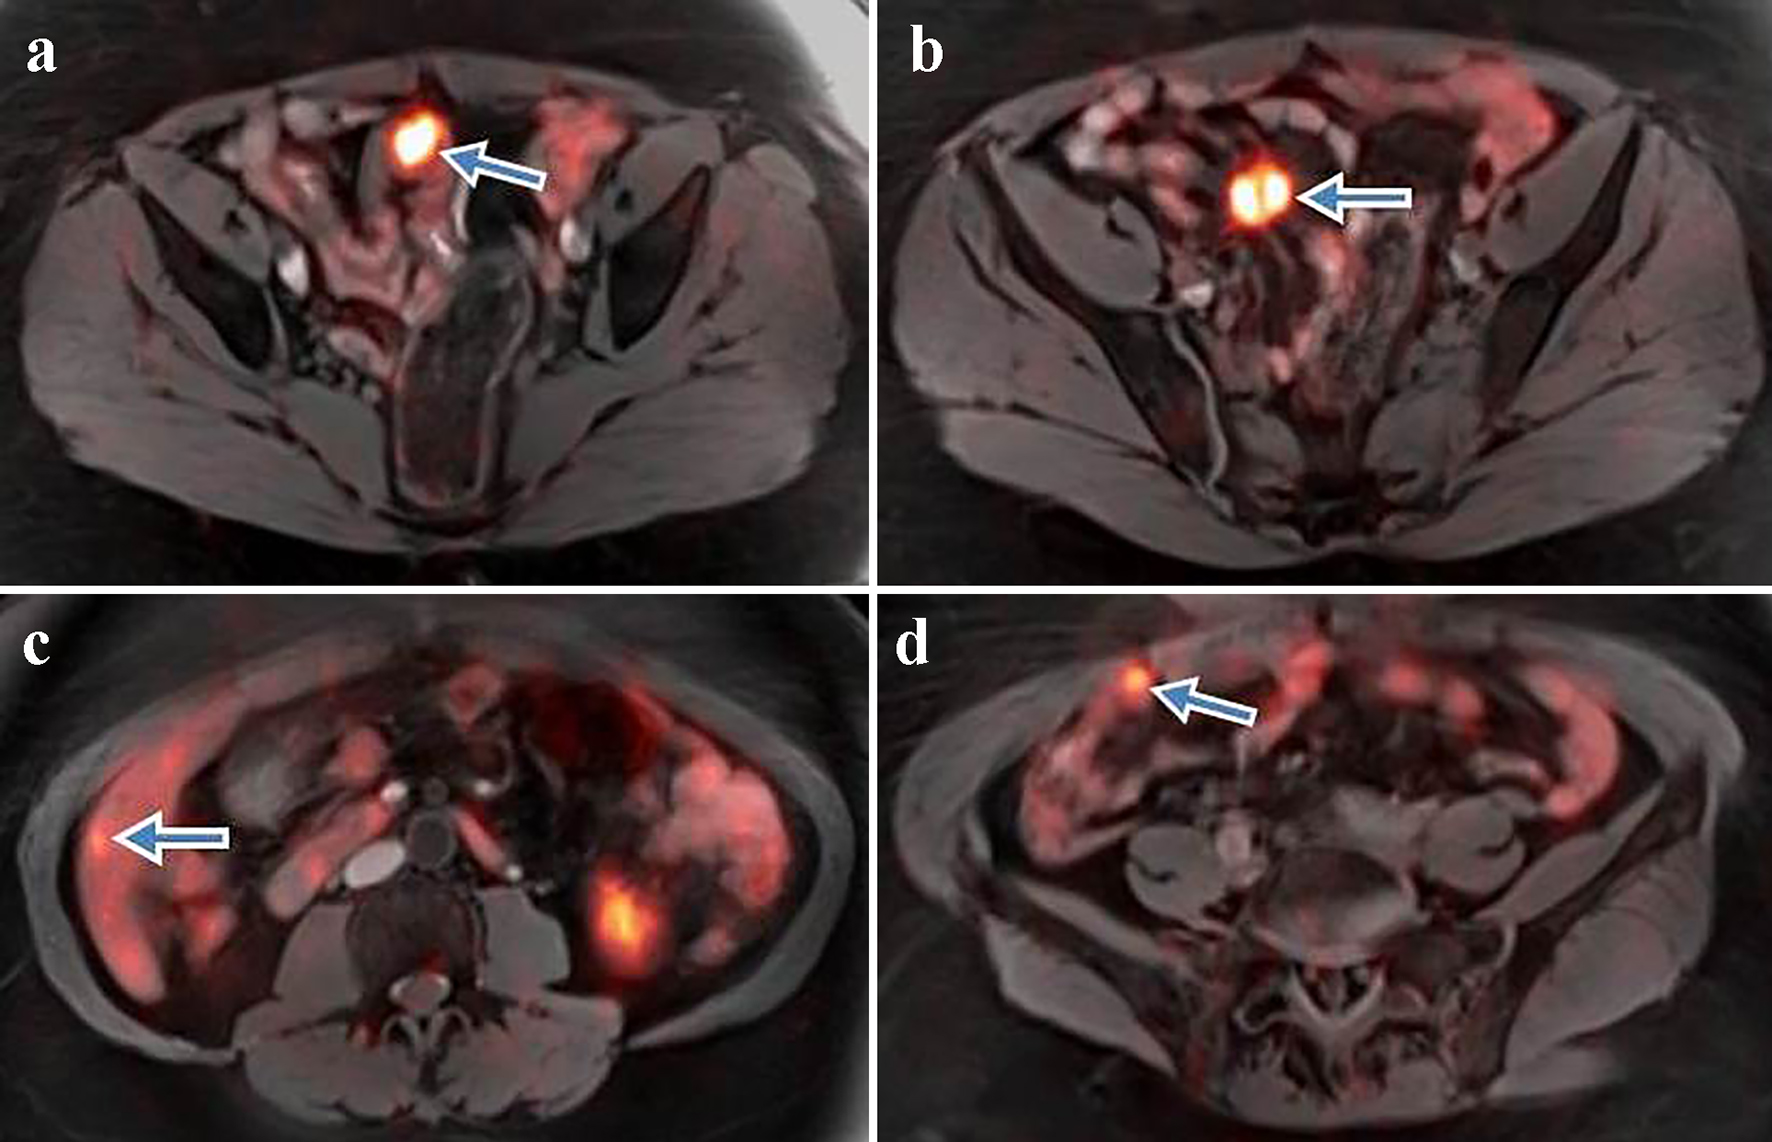
Figure 2. (a) Ga-68 DOTATATE PET-MRI shows a prominent somatostatin avid lesion (arrow) measuring 1.9 × 2.8 cm with SUV 28 within a loop of distal small bowel. (b) Well-defined 2.2 × 2.1 cm lesion (arrow) with prominent tracer uptake (SUV 22.3) adjacent to the small bowel mesentery. (c) Ga-68 PET-MRI displays a tiny focus (arrow) in segment 6 of the liver consistent with liver metastasis. (d) Small peritoneal lesion (arrow) with a high tracer uptake consistent with peritoneal carcinomatosis. Ga-68 DOTATATE PET-MRI: positron emission tomography-magnetic resonance imaging with gallium-68; SUV: standardized uptake value.
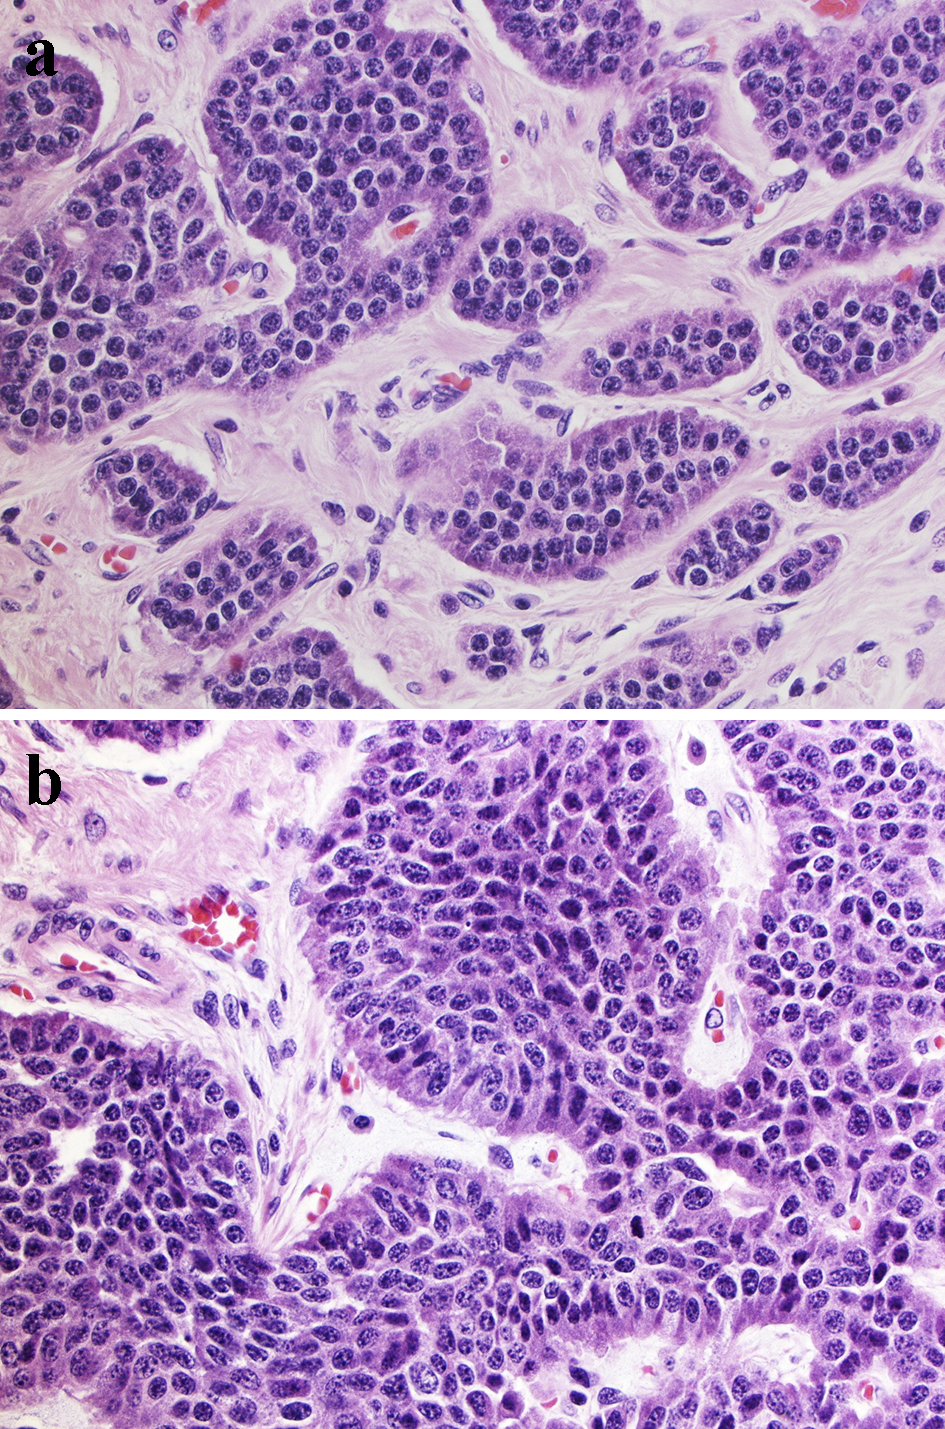
Figure 3. Morphologic presentation of poorly differentiated G3 NEC. Tumor cells are polygonal with moderate amount of cytoplasm with larger size than in small cell carcinoma, but smaller than in large cell NEC. The nuclei are pleomorphic, the chromatin is finely granular and nucleoli are seen. (a) Tumor area consistent with low Ki-67 (3-5%) (H&E, × 100 magnification); (b) Tumor area with high Ki-67 (25%) (H&E, × 100 magnification). NEC: neuroendocrine carcinoma; H&E: hematoxylin & eosin.
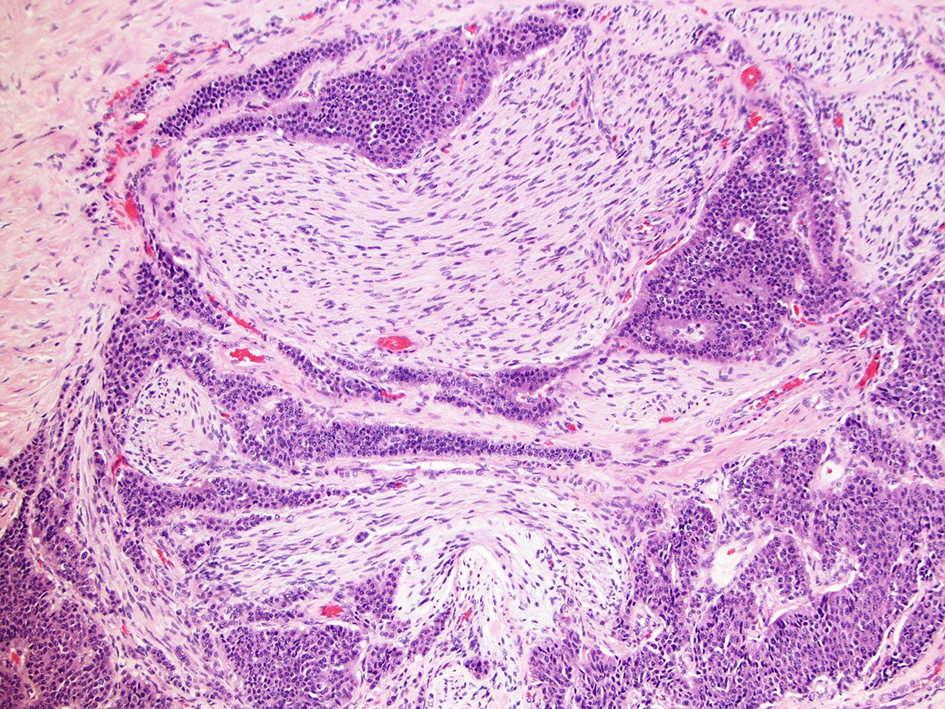
Figure 4. Perineural invasion in primary ileal NEC (H&E, × 40 magnification). NEC: neuroendocrine carcinoma; H&E: hematoxylin & eosin.
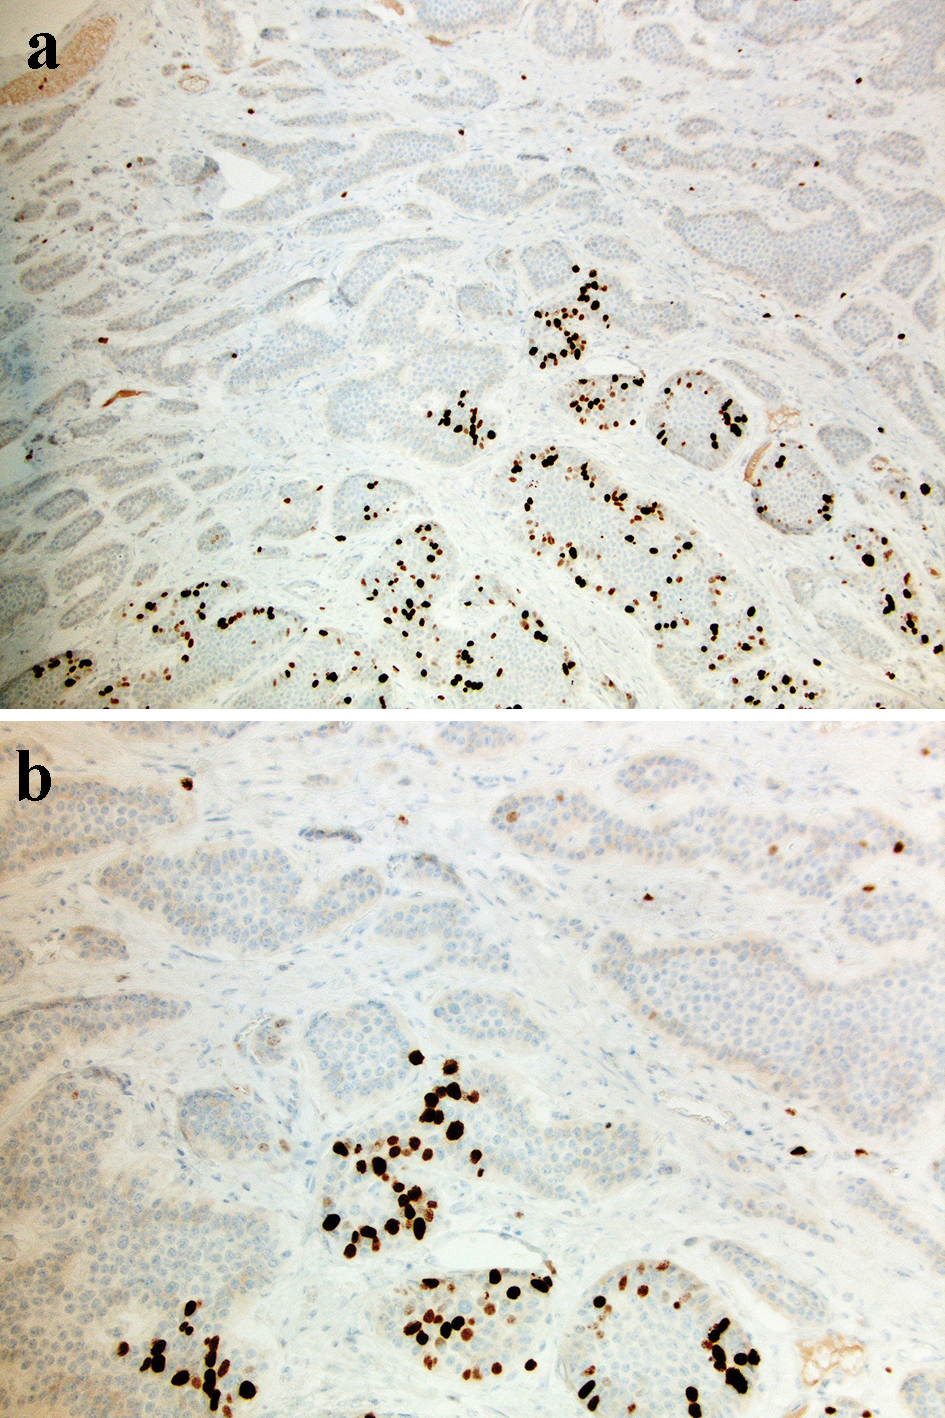
Figure 5. A Ki-67 stain shows primary tumor with various expression of Ki-67 ranging 3-25% (a: × 40 magnification; b: × 100 magnification).
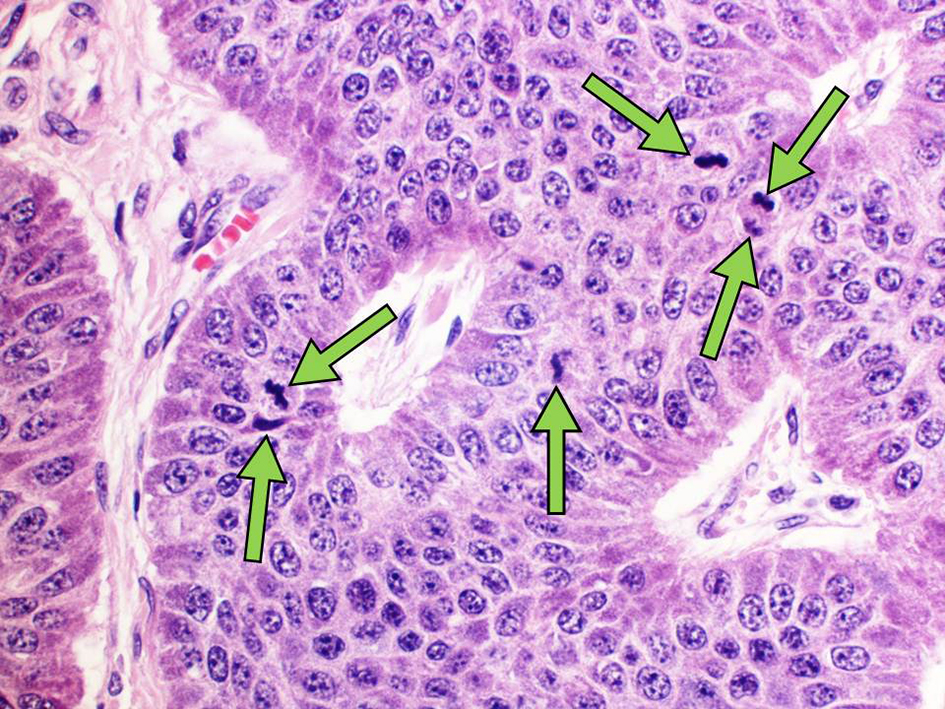
Figure 6. Mitotic tumor activity. Arrows identify mitotic figures in the nuclei of primary tumor cells (H&E, × 200 magnification). H&E: hematoxylin & eosin.