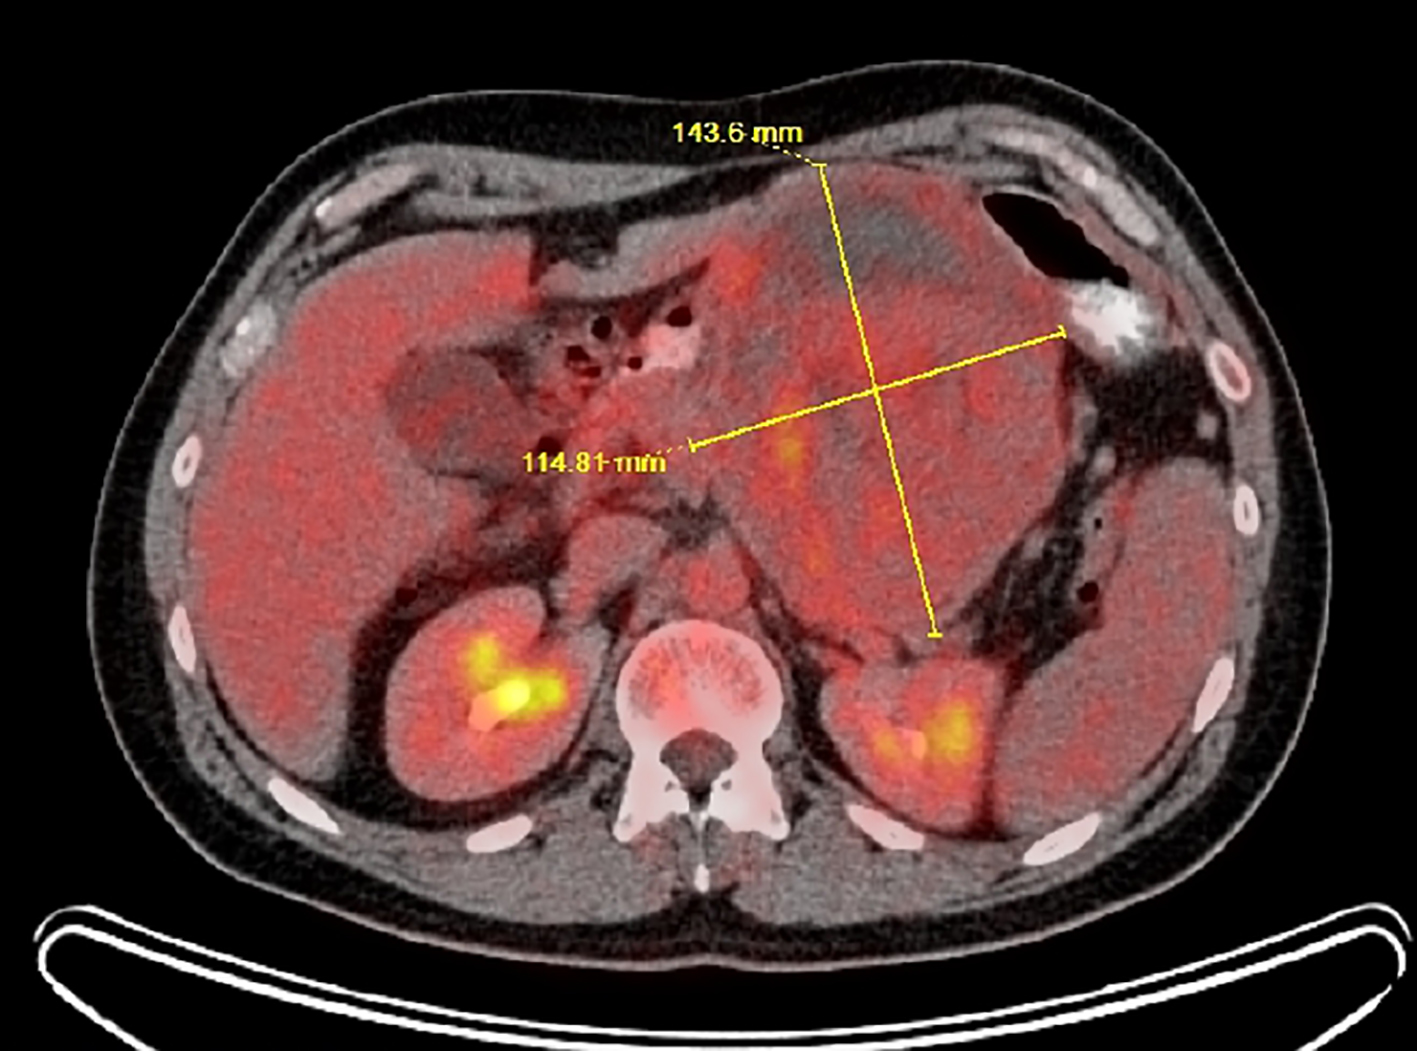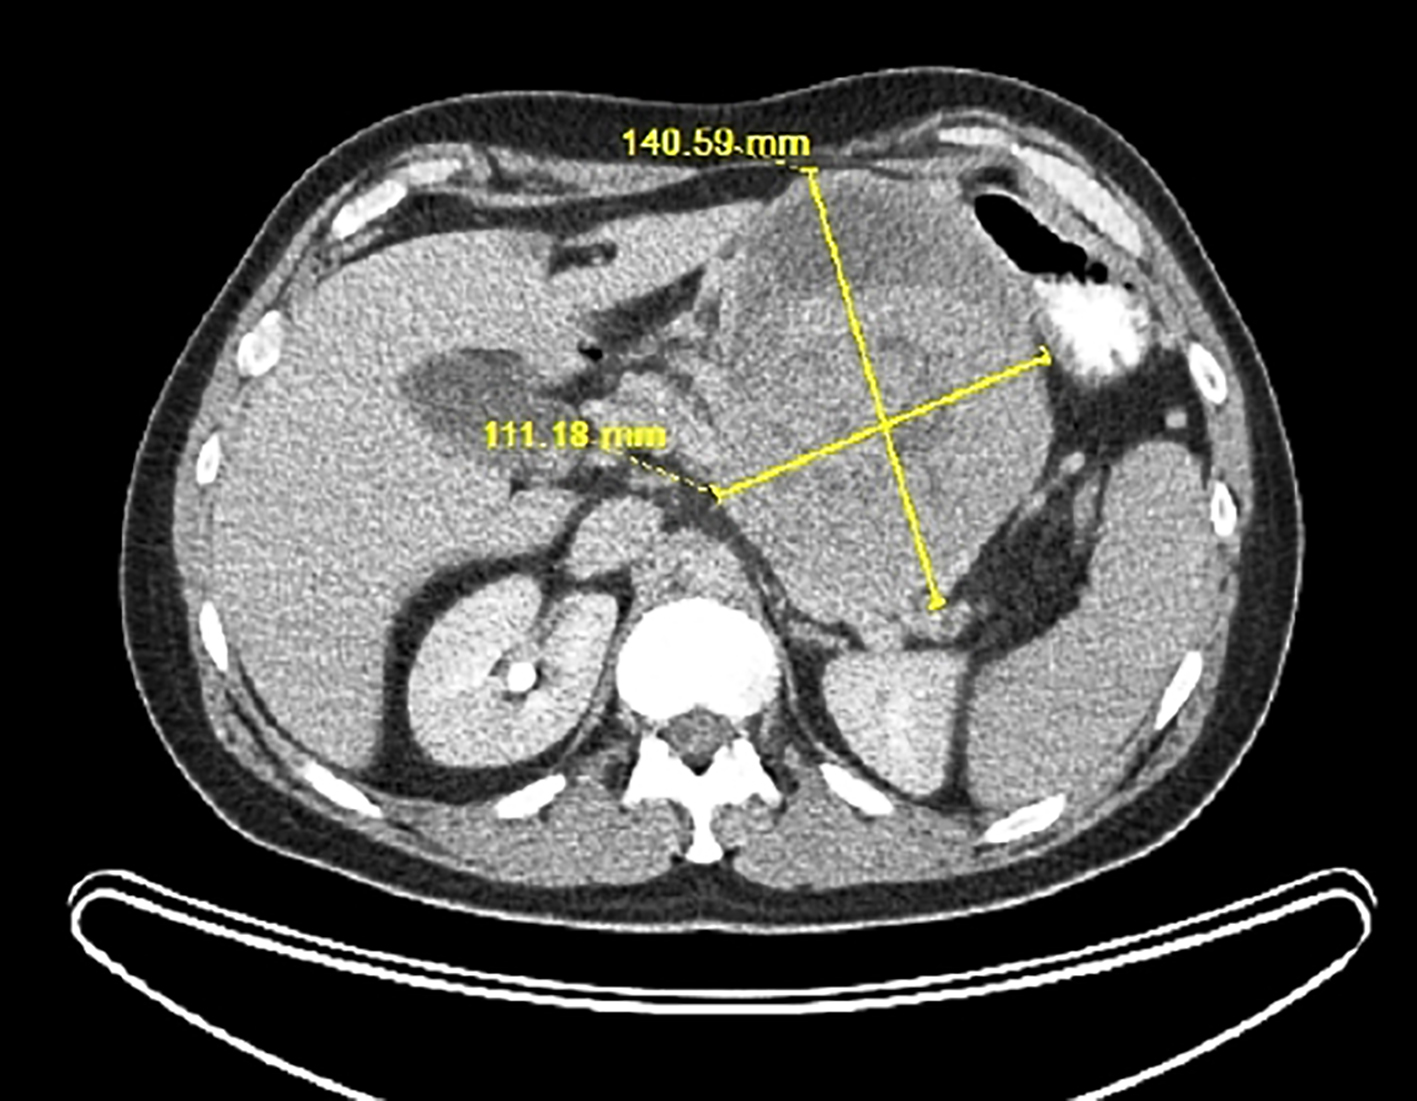
Figure 1. Abdominal CT scan of the left upper quadrant heterogeneous mass measuring 13.6 × 11.0 × 11.0 cm. The stomach is displaced laterally. CT: computed tomography.
| Journal of Medical Cases, ISSN 1923-4155 print, 1923-4163 online, Open Access |
| Article copyright, the authors; Journal compilation copyright, J Med Cases and Elmer Press Inc |
| Journal website http://www.journalmc.org |
Case Report
Volume 11, Number 1, January 2020, pages 16-21
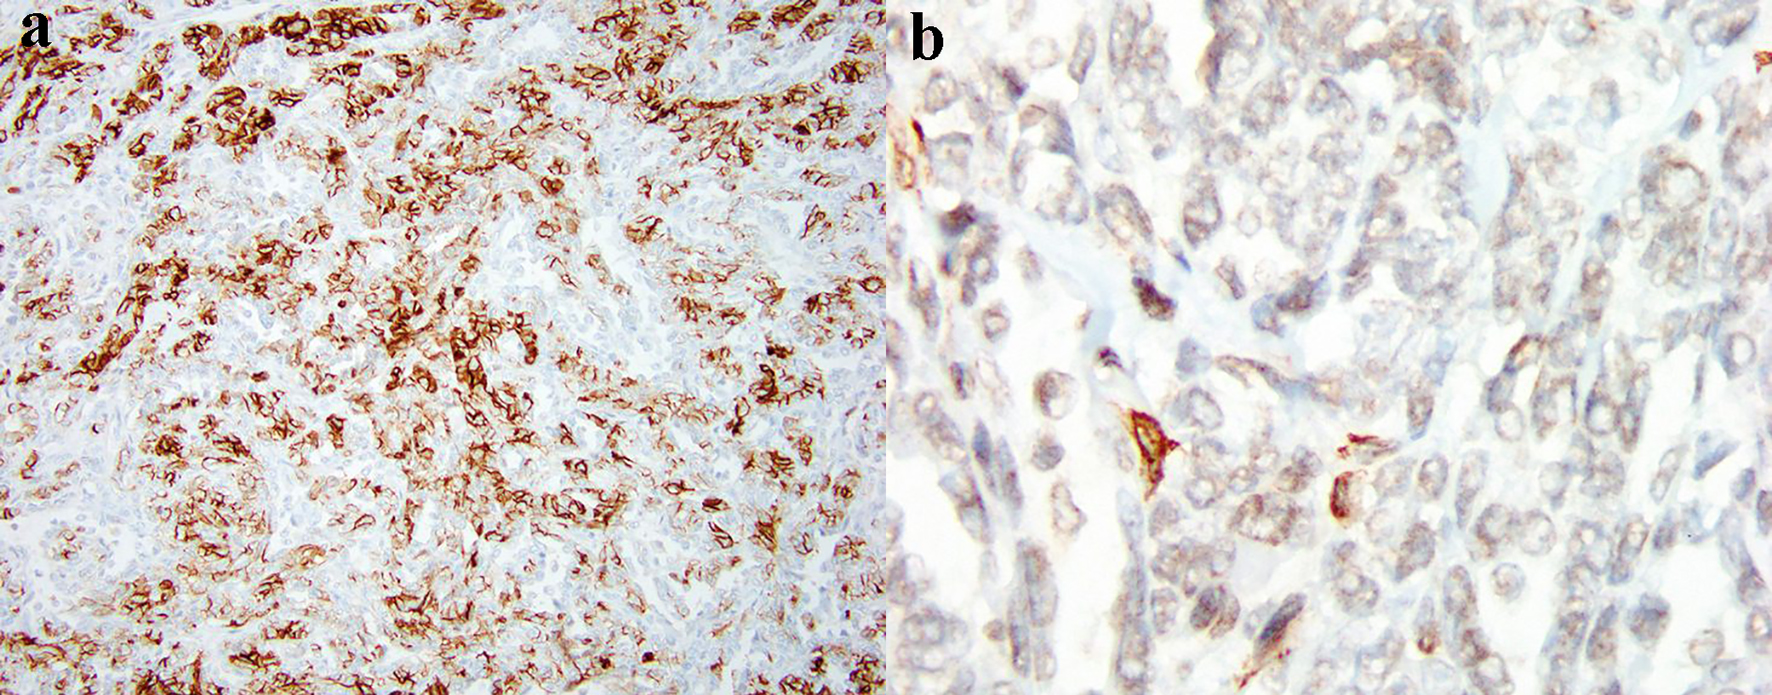
Soft-Tissue Myoepithelioma of the Retroperitoneal Space Mimicking a Pancreatic Tumor: A Case Report and Literature Review
Figures