Journal of Medical Cases, ISSN 1923-4155 print, 1923-4163 online, Open Access
Article copyright, the authors; Journal compilation copyright, J Med Cases and Elmer Press Inc
Journal website https://www.journalmc.org

Case Report

Volume 11, Number 10, October 2020, pages 320-323


Acute Plasma Cell Leukemia Presenting as Primary Hyperammonemic Encephalopathy

Figures

Figure 1.
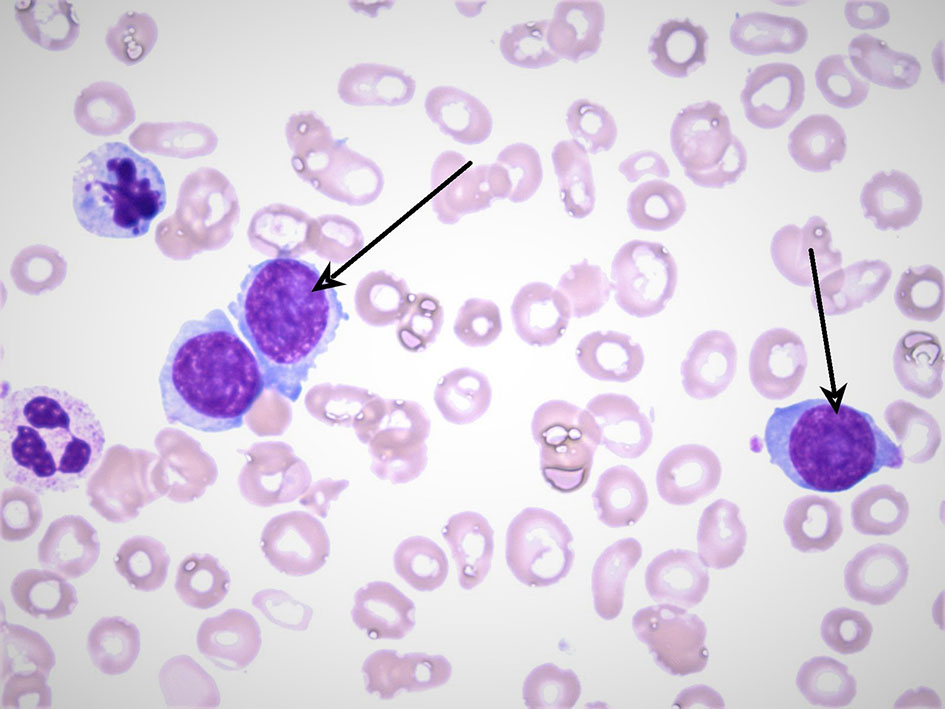
Figure 1. A peripheral blood smear with the arrows pointing at atypical plasma cells. The smear also reveals findings of anisopoikilocytosis and frequent target cells. Neutrophils are present with a mild left shift. Of note blasts are not seen.
Figure 2.
Figure 2. Multiple images including flow cytometry, bone marrow biopsy, and cytogenetic analysis (FISH). Flow cytometry (top left) shows a predominant kappa monotype restriction seen in red. Bone marrow biopsy (top middle) showing sheets of plasma cells 90-95%. FISH images display: a deletion of p53 (17p) (top right); an additional copy of CKS1B (1q) (bottom left); additional copy of IGH (14q) and loss of one MAF copy, no IGH/MAF t(14,16) translocation (bottom middle); positive variant CCND1/IGH t(11,14) translocation (bottom right). FISH: fluorescence in situ hybridization.
Figure 3.
Figure 3. Arrows pointing at CD138-positive (kappa restricted) sheets of plasma cells, appearing in color blue.