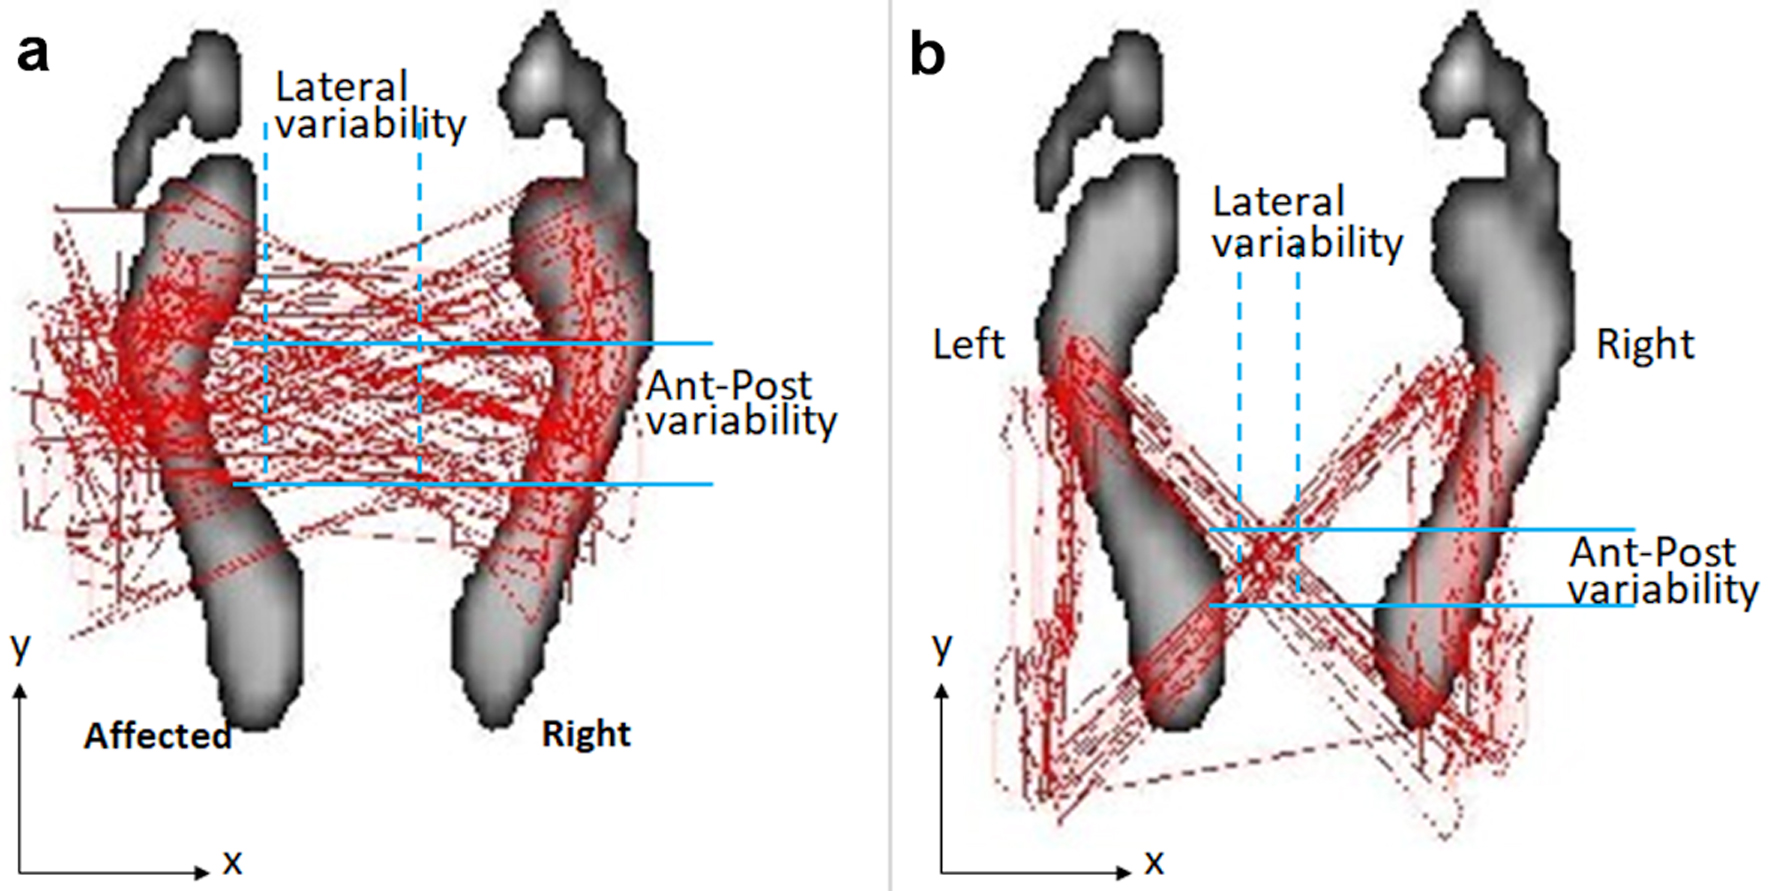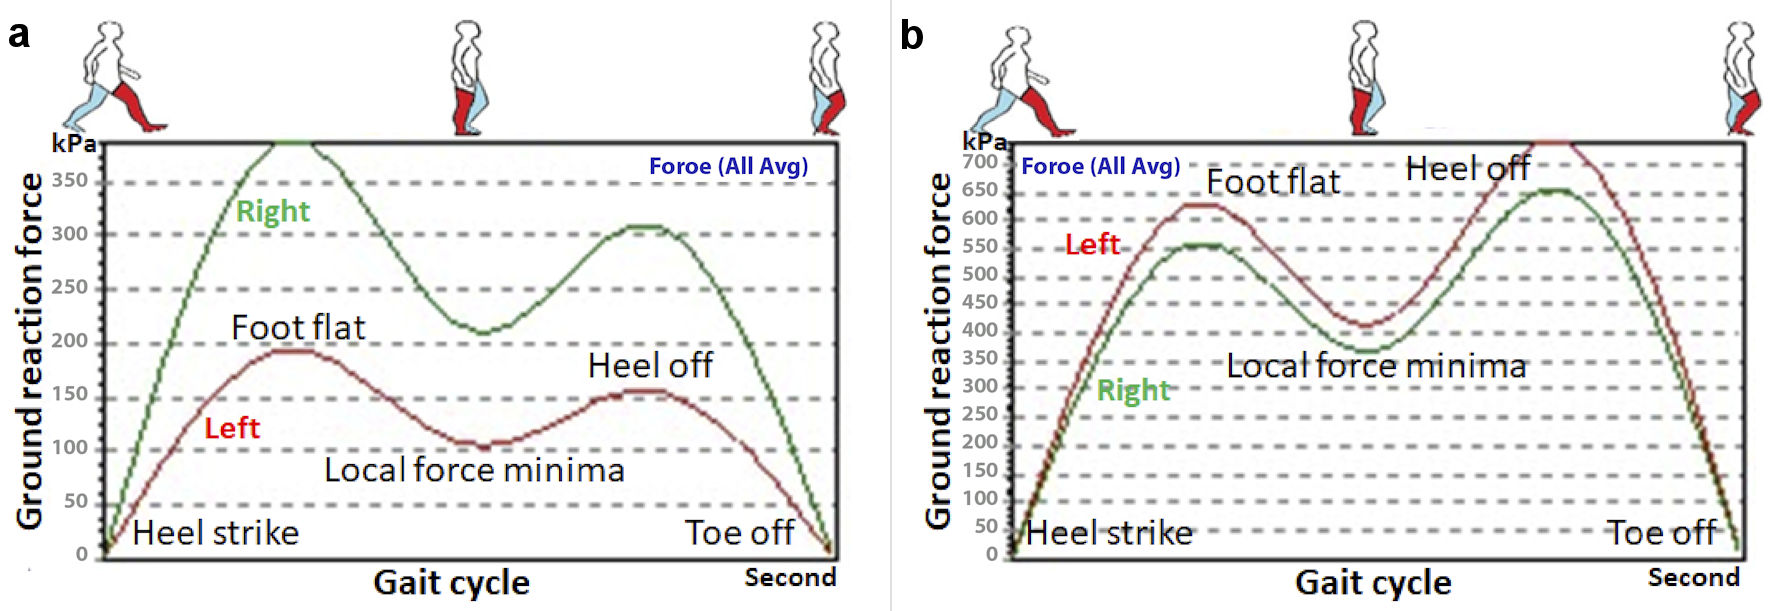
Figure 1. Walking cyclogram depicting notable improvement in gait characteristics after treatment. The traces (red butterfly plots) represent the trajectory of center of foot pressure on the instrumented treadmill. (a) Initially, the cyclogram showed a distorted butterfly wing feature, with a wider based gait, and great variability of stride and foot placement accuracy (blue intersected area). The disturbance was more pronounced on the left side. (b) After 3 months of intervention, the repeated cyclogram showed a more accurate foot stride, regular heel strike and symmetric and rhythmic center-of-pressure crossover between strides.
