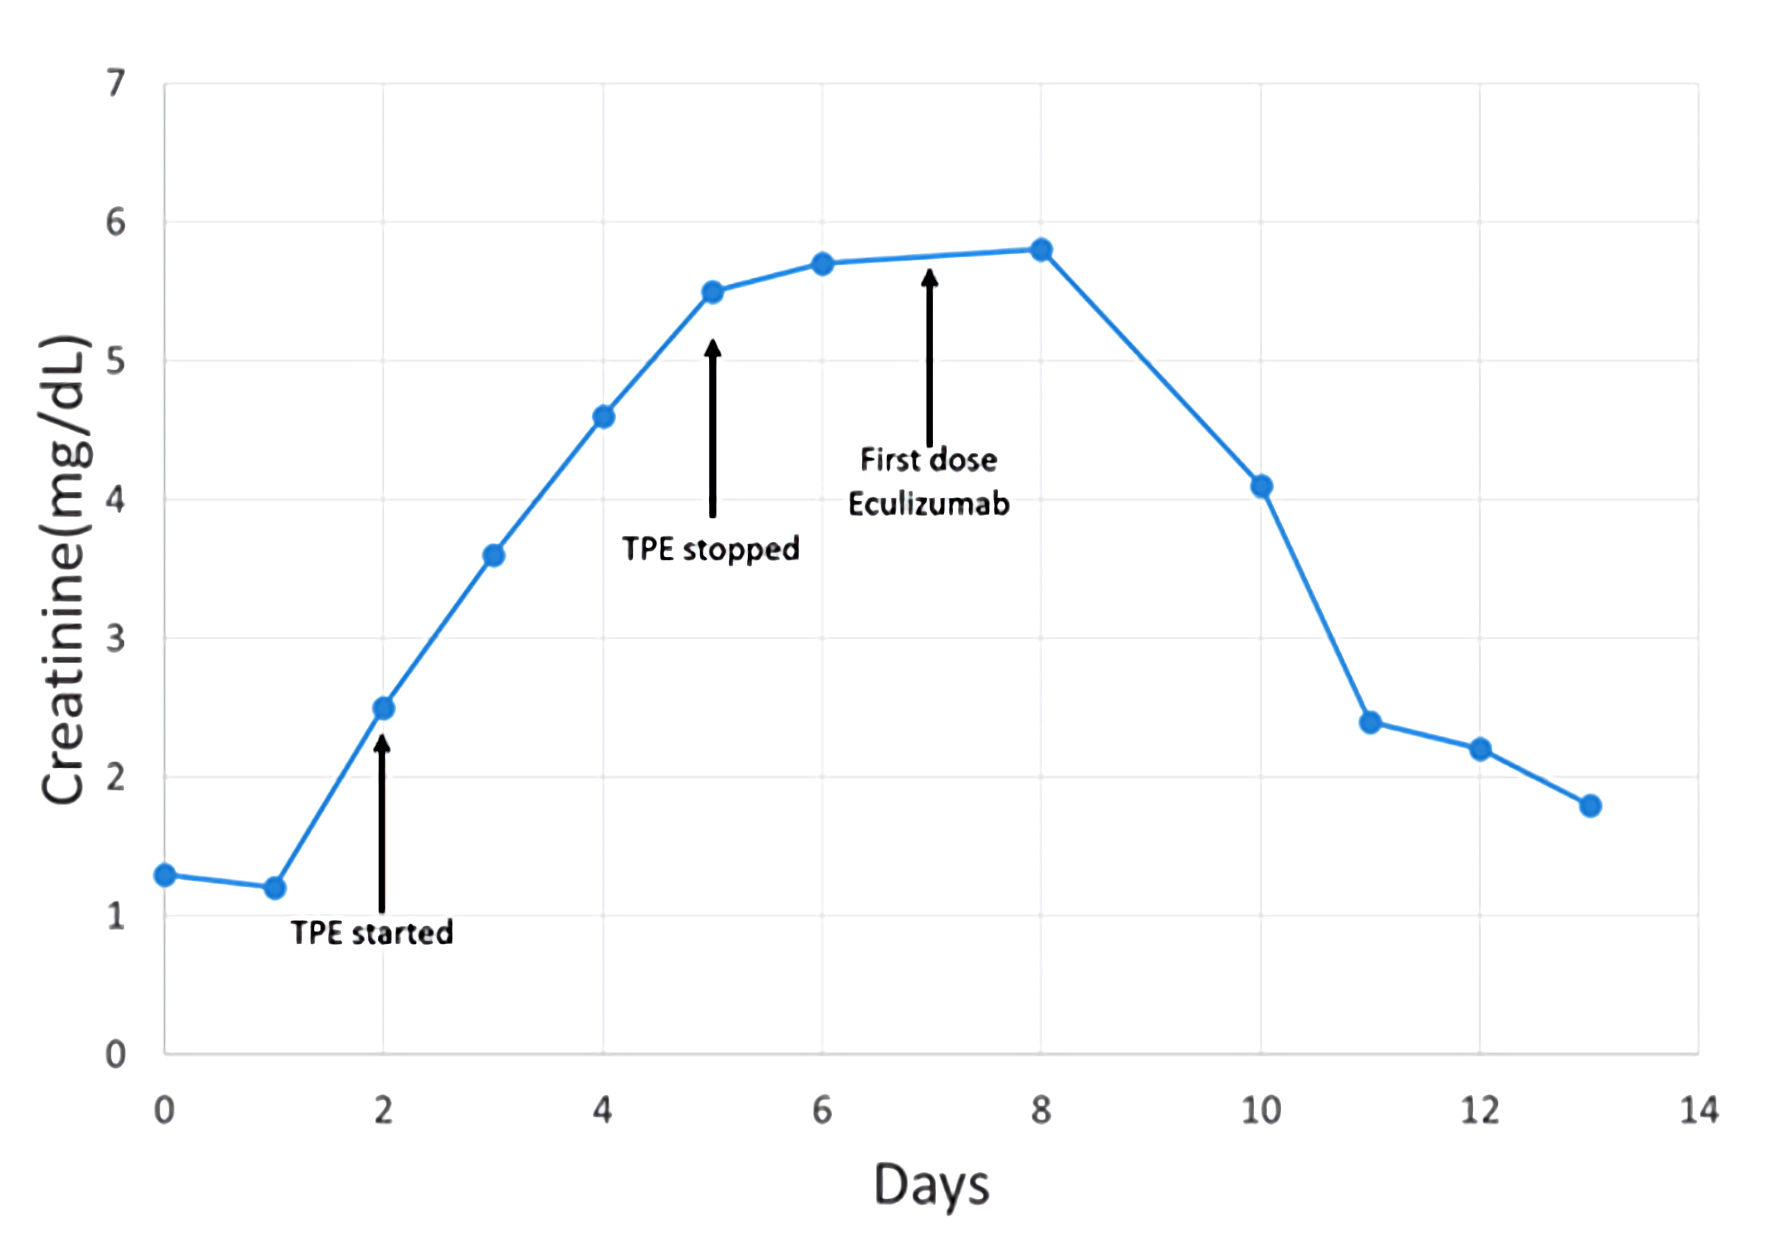
Figure 1. Patient timeline reflecting change in creatinine related to therapeutic interventions. TPE: therapeutic plasma exchange.
| Journal of Medical Cases, ISSN 1923-4155 print, 1923-4163 online, Open Access |
| Article copyright, the authors; Journal compilation copyright, J Med Cases and Elmer Press Inc |
| Journal website https://www.journalmc.org |
Case Report
Volume 13, Number 6, June 2022, pages 274-280
Carfilzomib-Induced Thrombotic Microangiopathy: Focus on Pathogenesis
Figures
Tables
| Analyte | Value | Reference range |
|---|---|---|
| White blood cells | 11,000/µL | 4,400 - 10,700/µL |
| Hemoglobin | 11.6 g/dL | 12.0 - 15.5 g/dL |
| Mean corpuscular volume | 92 fL | 81 - 97 fL |
| Platelet count | 2,000/µL | 150,000 - 400,000/µL |
| Blood urea nitrogen | 29 mg/dL | 7 - 26 mg/dL |
| Serum creatinine | 1.3 mg/dL | 0.50 - 1.3 mg/dL |
| Total bilirubin | 4.2 mg/dL | 0.2 - 1.0 mg/dL |
| Direct bilirubin | 0.4 mg/dL | 0.0 - 0.5 mg/dL |
| Albumin | 3.0 g/dL | 3.4 - 5.0 g/dL |
| Prothrombin time | 10.9 s | 12.1 - 14.8 s |
| International normalized ratio | 1.1 | |
| Haptoglobin | < 8 mg/dL | 30 - 200 mg/dL |
| Direct antibody test | Negative | |
| Lactate dehydrogenase | 1,757 U/L | 125 - 243 U/L |
| Fibrinogen | 368 mg/dL | 200 - 400 mg/dL |
| D-dimer | 5.63 mg/L | 0.17 - 0.5 mg/L |
| Analyte | Before presentation | At presentation | Peak abnormal value | Two weeks after presentation (discharge) |
|---|---|---|---|---|
| Hemoglobin (g/dL) | 11.1 | 11.6 | 5.3 (day 3) | 7.3 |
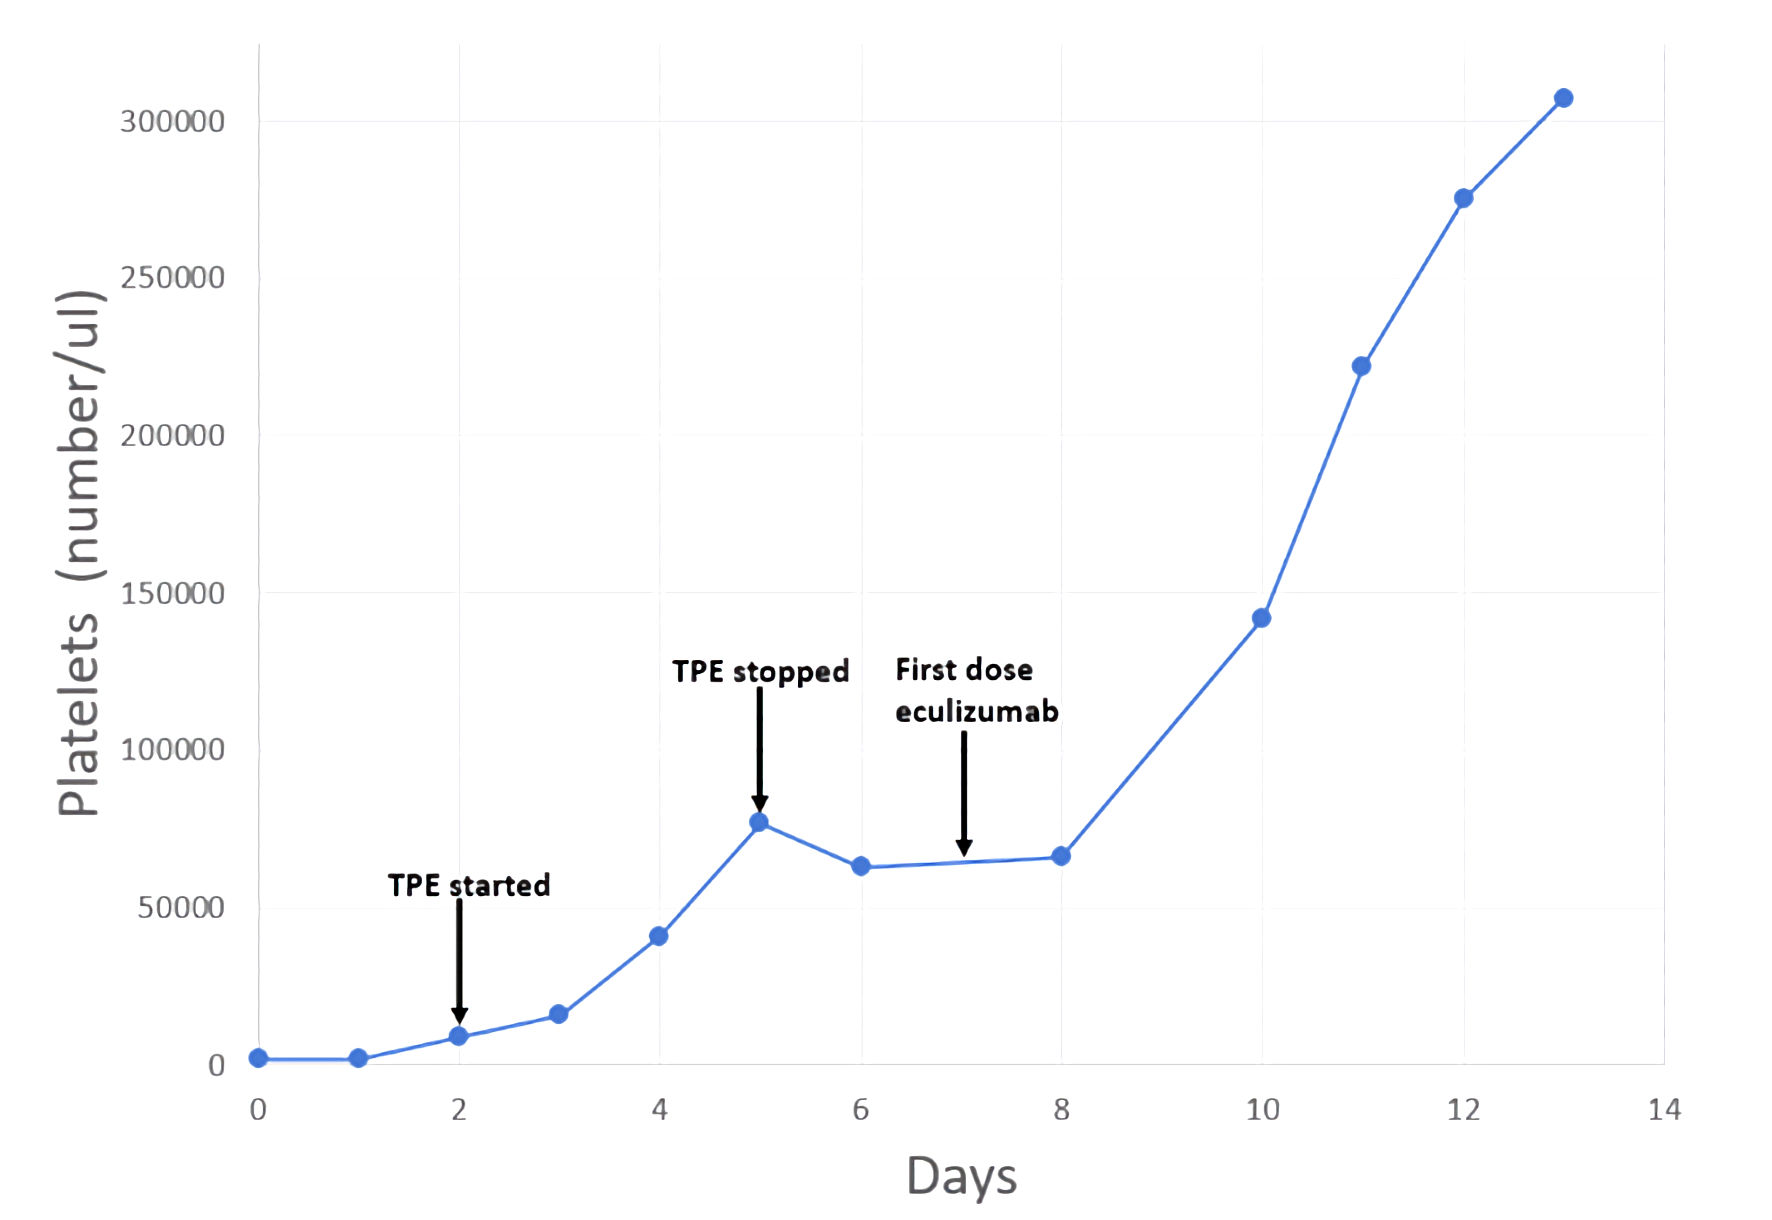
| Platelets (/µL) | 251,000 | 2,000 | 2,000 | 307,000 |
| Serum creatinine (mg/dL) | 0.8 | 1.3 | 5.8 (day 8) | 1.8 |
| Lactate dehydrogenase (U/L) | 163 | 1,757 | 1,757 | 433 |
| Total bilirubin (mg/dL) | 0.5 | 4.2 | 4.2 | 0.5 |