Journal of Medical Cases, ISSN 1923-4155 print, 1923-4163 online, Open Access
Article copyright, the authors; Journal compilation copyright, J Med Cases and Elmer Press Inc
Journal website https://www.journalmc.org

Case Report

Volume 15, Number 1, January 2024, pages 1-6


Focal Hepatocellular Carcinoma in Pancreas

Figures

Figure 1.
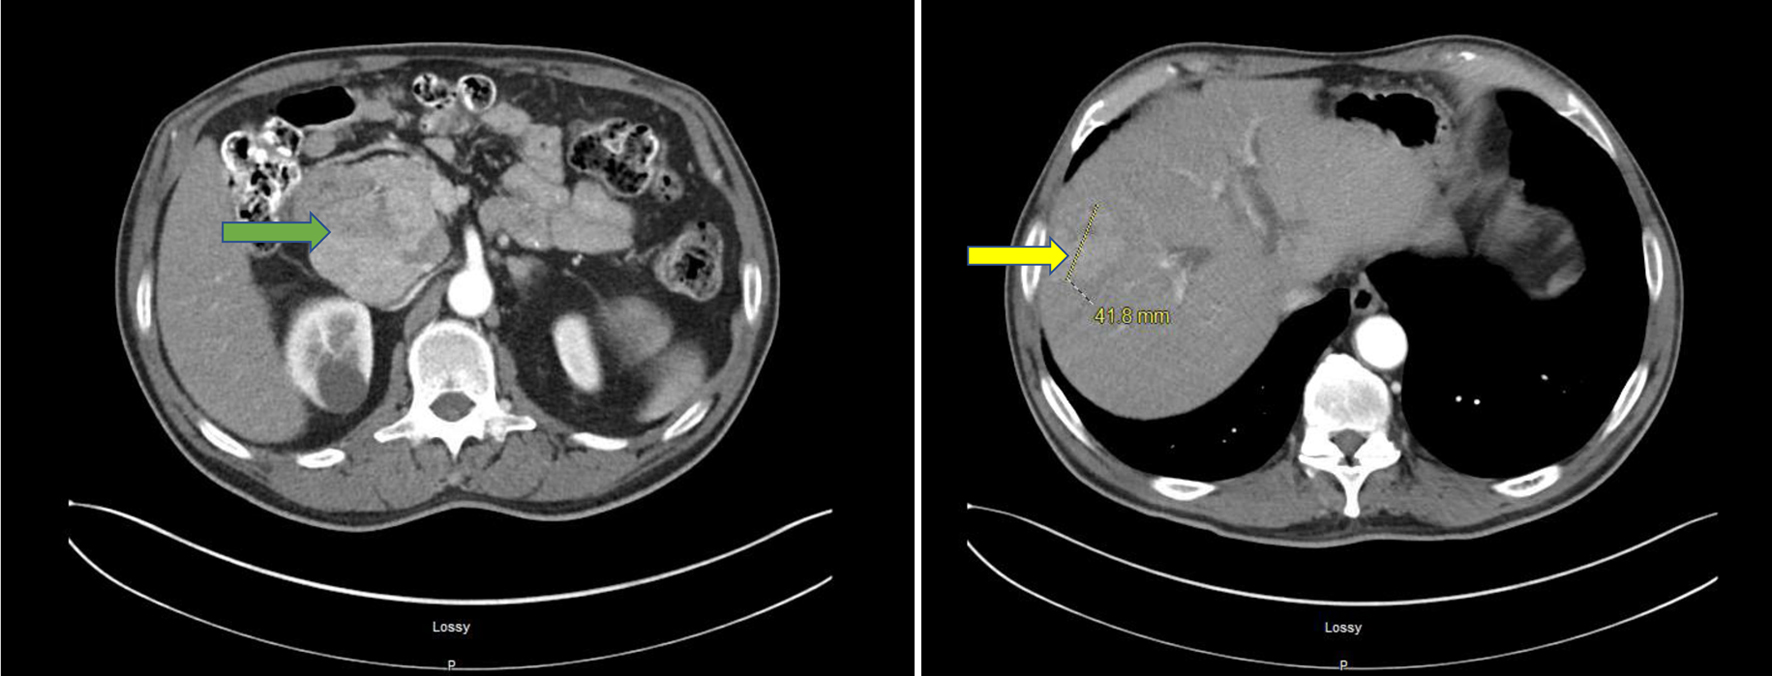
Figure 1. CT of abdomen and pelvis with IV contrast. A 101 × 69 mm mixed attenuation mass involving the head of pancreas (green arrow) is shown. Pancreatic duct dilation is not seen. Fatty infiltration of the liver with 41.8 × 63 mm mixed attenuation mass in the right hepatic lobe (yellow arrow) is shown. Right renal parenchymal cyst is shown. CT: computed tomography.
Figure 2.
Figure 2. An oval mass measuring 100 × 80 mm in the head of pancreas seen on endoscopic ultrasound (blue arrow).
Figure 3.
Figure 3. Hematoxylin and eosin stain of lymph node specimen showing small and large nests of neoplastic cells with large amount of cytoplasm, prominent nucleoli and intranuclear inclusions (thin black arrows). Few areas of tumor necrosis are seen.
Figure 4.
Figure 4. Pancreatic FNA specimen showing tumor cells staining positive for Hep Par-1 on immunohistochemical stain (thin blue arrow). FNA: fine-needle aspiration.
Figure 5.
Figure 5. Pancreatic FNA specimen showing tumor cells staining positive for arignase-1 on immunohistochemical stain (thin black arrow). FNA: fine-needle aspiration.