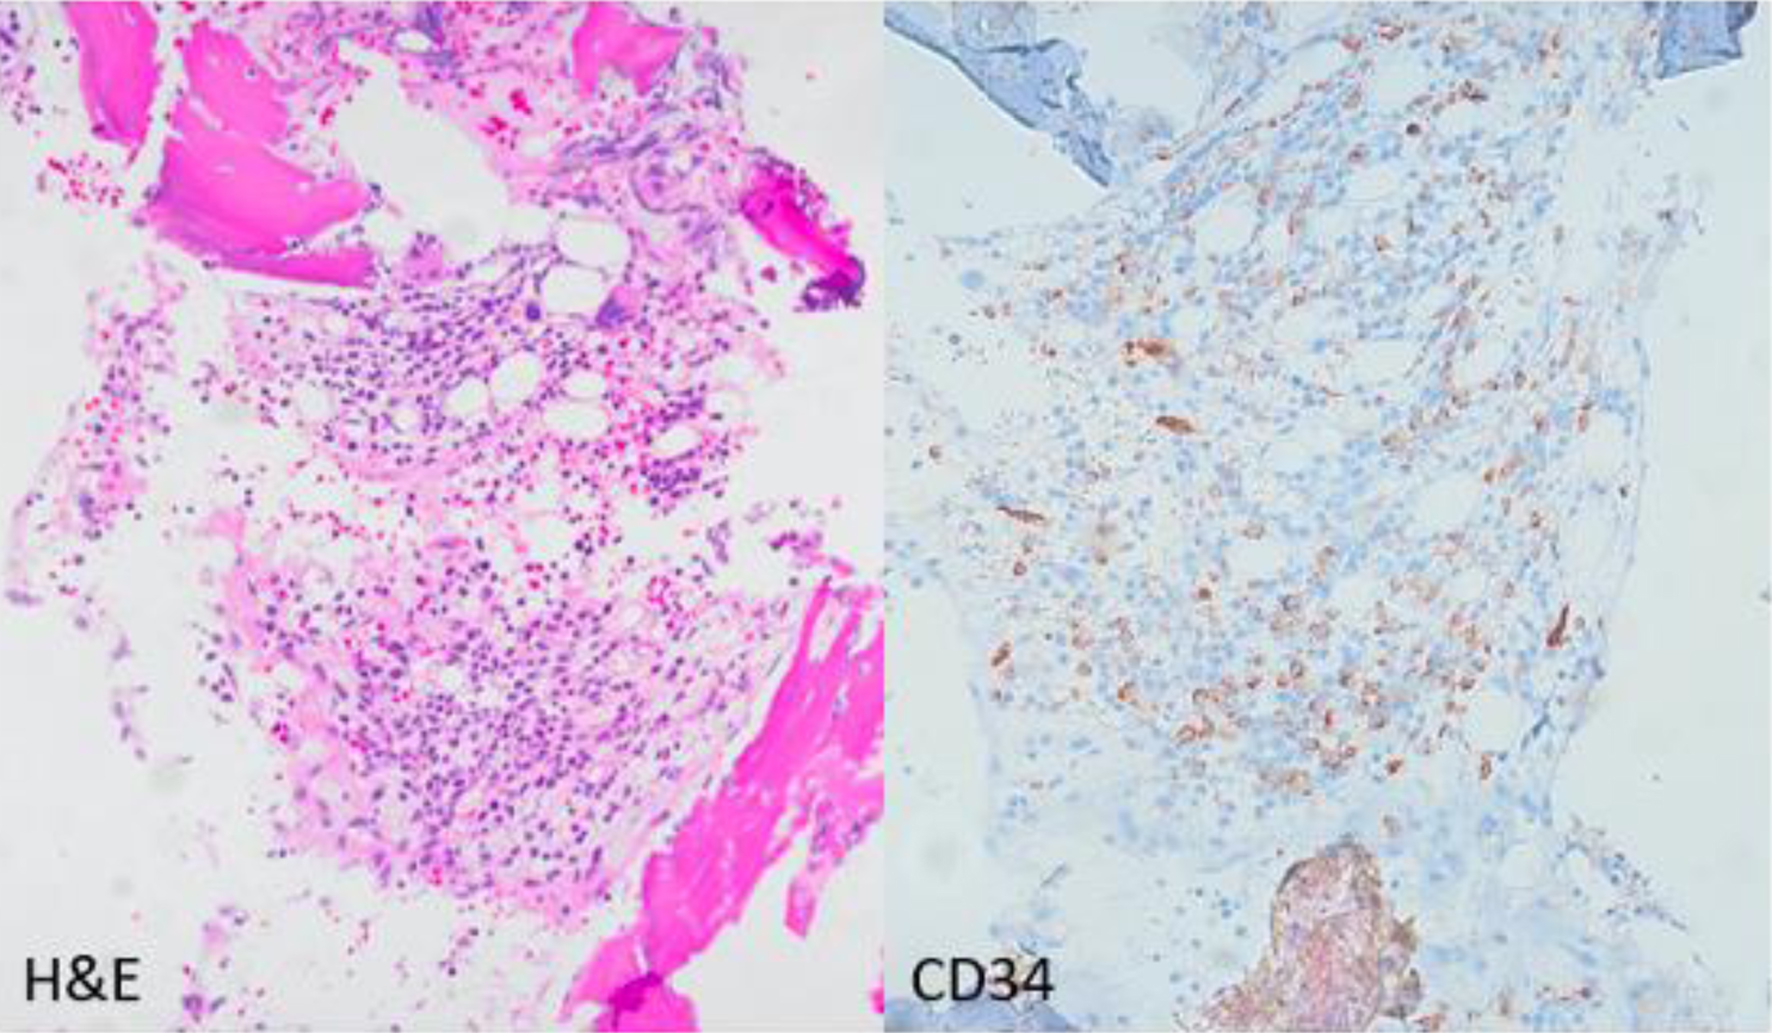
Figure 1. Photomicrograph (× 200) of the bone marrow core biopsy highlighting CD34 positive blasts comprising approximately 15% of the bone marrow elements. Hematoxylin and eosin stain (H&E) on left, CD34 immunohistochemical stain on the right.
| Journal of Medical Cases, ISSN 1923-4155 print, 1923-4163 online, Open Access |
| Article copyright, the authors; Journal compilation copyright, J Med Cases and Elmer Press Inc |
| Journal website https://www.journalmc.org |
Case Report
Volume 15, Number 9, September 2024, pages 250-255
Clinical, Phenotypic and Molecular Characterization of NUP214-ABL1 Fusion Positive Myeloid Malignancies
Figures